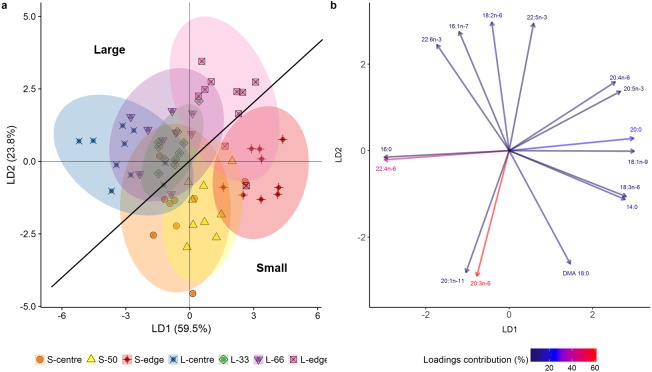
Figure 4. Linear discriminant analysis (LDA) (A) score plot and (B) biplot, showing overall fatty acid profile (mg g lipid−1) of distal intracolonial locations in two size classes of Acropora millepora colonies.
L-centre: larger colony centre, L-33: 33.3% of the longitudinal radius length, L-66: 66.6% of the longitudinal radius length, L-edge: larger colony edge, S-centre: smaller colony centre, S-50: 50% of the longitudinal radius length, S-edge: smaller colony edge (S-edge). (A) Ellipses show 95% confidence intervals for each treatment. (B) Vectors show top fifteen individual fatty acids and fatty alcohols contributing to the overall variance between treatments. Colour gradient shows percentage contribution to LDA loadings. For each size class, n = 10.

