
Figure 2.
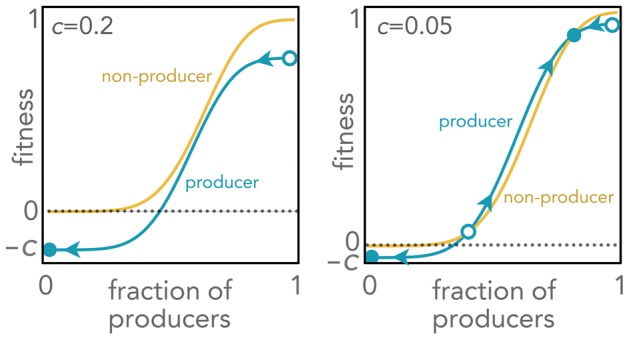
Fitness of producer and non-producer cells as a function of the fraction of producer cells for different costs of growth factor production c. Equilibria (full circles: stable; open circles: unstable) and the direction of the dynamics (arrows) are shown