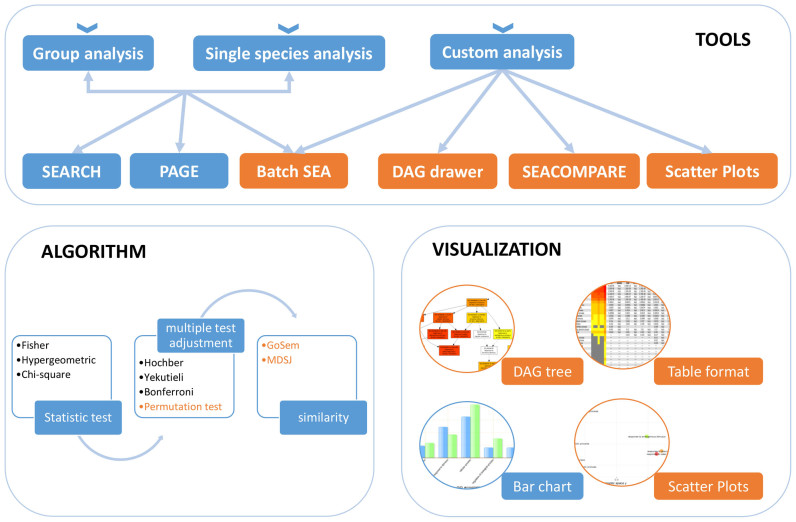
Figure 1.
The analysis framework for agriGO v2.0. AgriGO v2.0 provides three analysis entrances and six major tools. For all query lists, P-values are computed and adjusted by multiple testing corrections or permutation tests. Then, significant GO terms can be further analyzed for similarity or parent–child hierarchical structures. Four visualization methods can help users understand the results. The orange color represents the new function in agriGO v2.0.

