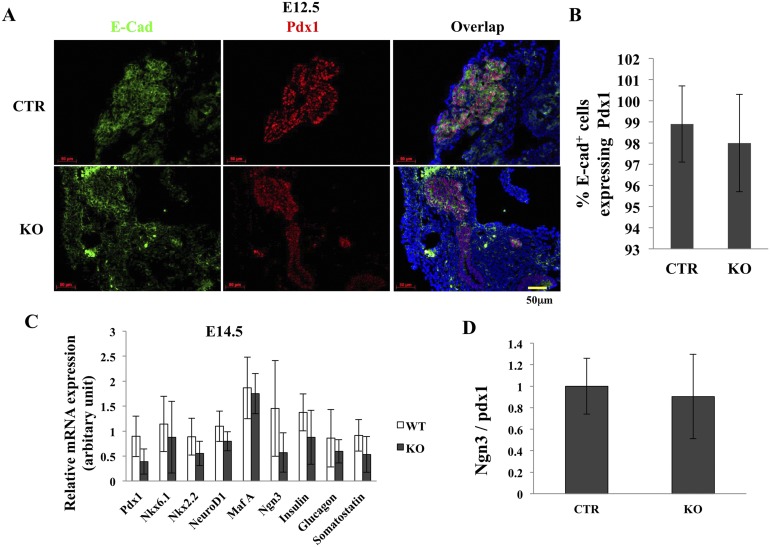
Figure 3.
Pancreas endocrine differentiation in CTR and KO mice. (A) Immunohistochemical staining of pancreas from CTR and KO mice using anti–E-cadherin (green) and anti-Pdx1 (red) antibodies. Nuclei are stained blue. Scale bar = 50 μm. (B) Percentages of Pdx1+ cells/E-cadherin+ cells in pancreas from CTR and KO mice. (C) Quantitative RT-PCR analysis of expression of endocrine differentiation-related genes in CTR and KO mice at E14.5. (D) Quantitative RT-PCR analysis of Ngn3/Pdx1 mRNA ratio in CTR and KO mice at E14.5. Data in (C) and (D) were normalized to β-actin expression. Scale bar = 50 μm. At least four embryos from each genotype were analyzed.

