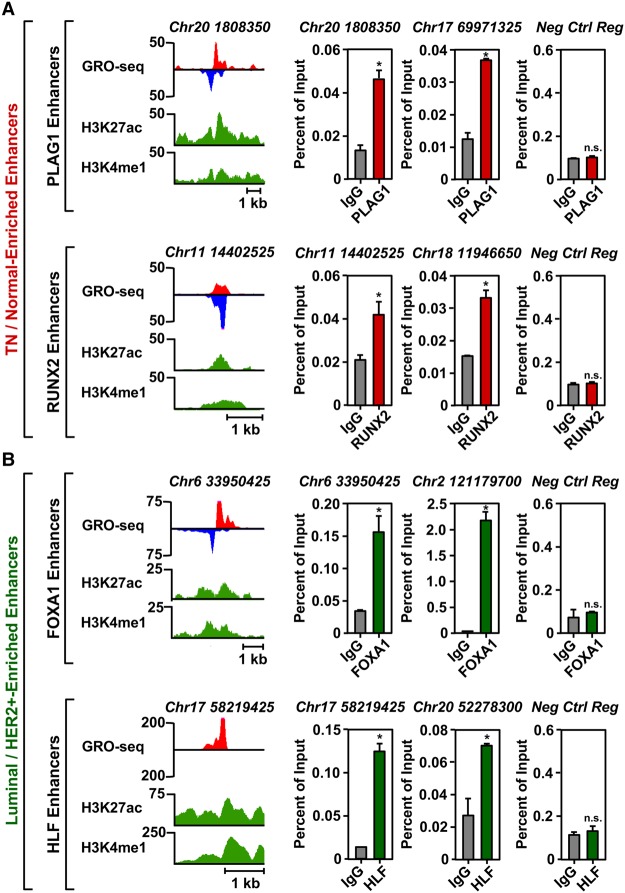
Figure 5.
TFSEE-predicted transcription factors are enriched at sites of enhancer transcription. (A) Genome browser views of transcribed enhancers (GRO-seq; H3K27ac and H3K4me1) (left) and corresponding ChIP-qPCR experiments for their cognate predicted TFs (right) for two TFs highly enriched in the TN/Normal-Like clade based on TFSEE: PLAG1 (top) and RUNX2 (bottom). The data shown are from TN basal breast cancer cells (HCC-1937). Enhancer transcription provides a measure of activity and the locations of the enhancers, whereas ChIP-qPCR confirms the binding of the predicted TF at that site. The enhancers are designated by their genomic coordinates. A negative control region not bound by the predicted TFs is shown for comparison. Each bar represents the mean + SEM, n = 3. Asterisks indicate significant differences from the corresponding control (Student's t-test, P-value < 0.05). (n.s.) not significant (Student's t-test, P-value > 0.05). (B) A set of experiments similar to those shown in A for two highly enriched TFs in the Luminal/HER2+ clade: FOXA1 (top) and HLF (bottom). The data shown are from Luminal A breast cancer cells (MCF-7). Each bar represents the mean + SEM, n = 3. Asterisks indicate significant differences from the corresponding control (Student's t-test, P-value < 0.05). (n.s.) not significant (Student's t-test, P-value > 0.05).

