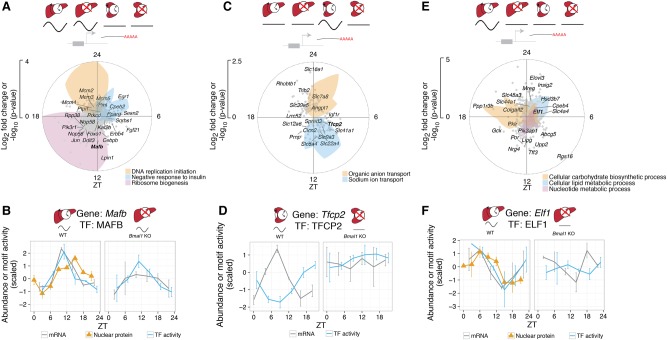
Figure 3.
Oscillatory TF activity in one tissue but not others can drive tissue-specific rhythms. (A) Module describing system-driven liver-specific rhythms (n = 1395, first SVD component explains 84% of variance). Radial coordinate of the colored polygons represents enrichment of the indicated GO terms at each time point, obtained by comparing the genes falling in a sliding window of ±3 h to the background set of all 1395 genes assigned to the module (P-value computed from Fisher's exact test). (B) MAFB is a candidate TF for the module in A. Predicted MAFB activity (blue), nuclear protein abundance (orange triangles), and mRNA accumulation (gray) oscillate in WT and Bmal1 KO, with peak mRNA preceding peak nuclear protein and TF activity. Error bars in nuclear protein, mRNA, and TF activity show SEM (n = 2). (C) Clock-driven kidney-specific module (n = 156, first SVD component explains 80% of variance). Colored polygons as in A. (D) TFCP2 is a candidate TF for the module in C. The temporal profile of predicted TFCP2 activity (blue) is anti-phasic with Tfcp2 mRNA accumulation (gray) in WT, and both are flat in Bmal1 KO. Error bars in mRNA and TF activity show SEM (n = 2). (E) Clock-driven liver-specific module (n = 991, first SVD explains 83% of variance). (F) ELF is a candidate TF for the module in E. The temporal profile of predicted ELF activity (blue) in WT matches that of nuclear protein abundance in liver (orange triangles), and both are delayed compared to Elf1 mRNA accumulation (gray). In Bmal1 KO, ELF activity and Elf1 mRNA are nonrhythmic. Error bars in nuclear protein, mRNA, and TF activity show SEM (n = 2).

