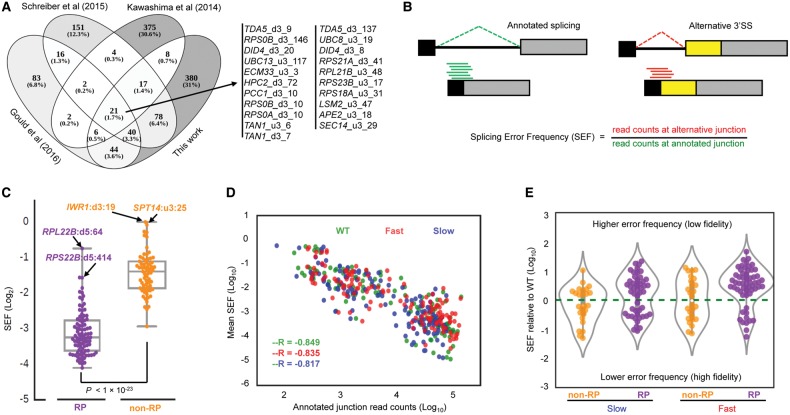
Figure 2.
Changes in splicing error frequency (SEF) in fast and slow strains. (A) Overlap between novel splicing events found in this work with those in recent reports. We do not detect some of the events reported in the other studies most likely because we filter out events with fewer than five supporting reads (see text). Kawashima et al. (2014) reported any event detected with one or more supporting read. Schreiber et al. (2015) reported events supported by at least three reads. Gould et al. (2016) calculated an entropy value for each junction and reported all the events with entropy ≥2 bits. (B) Diagram showing how SEF of novel splicing events was measured using an alternative upstream 3′SS event as an example. (C) Distribution of the SEF in RP (purple) and non-RP (orange) intron-containing transcripts in the WT strain. Events with high SEF are highlighted (u3 and d3 are alternative upstream and downstream 3′SS, and d5 is alternative downstream 5′SS; numbers indicate the distance in nucleotides). The P-value was obtained by t-test. (D) Negative correlation between mRNA (both RP and non-RP) abundance and average SEF in fast (red), slow (blue), and WT (green). mRNA abundance was estimated from the number of reads aligned to the exon–exon junctions. –R is Pearson's correlation coefficient. P-values for each strain were as follows: fast, P < 1 × 10⁻³³; slow, P < 1 × 10⁻³¹; and WT, P < 1 × 10−38. (E) Violin plot showing distribution of SEF of non-RP and RP intron-containing transcripts in fast and slow mutants normalized to WT. This plot includes all novel splicing events whose SEF was significantly different in mutants relative to WT (Fisher's exact test; P < 0.01, FDR < 0.03). Points above dashed line (zero) are novel events with higher SEF than WT (reduced fidelity); points below dashed line are novel events with lower SEF than WT (improved splicing fidelity).

