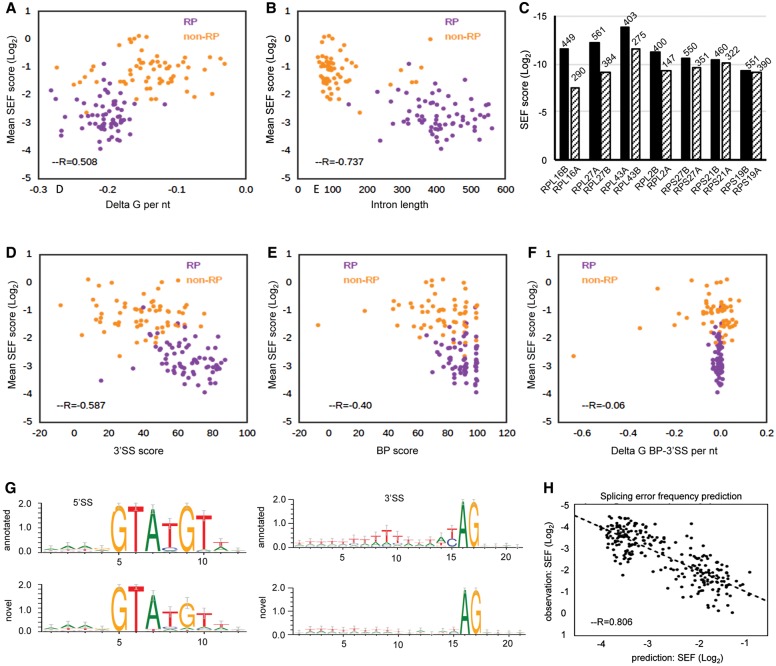
Figure 4.
Features associated with SEF. Orange points represent novel events in non-RP transcripts, and purple points denote RP transcripts. (A) Positive correlation between delta G of intron (see Methods) and mean SEF of the transcripts. Delta G of intron was divided by the intron length to achieve delta G per nucleotide. More negative delta G values represent more structured introns. (B) Negative correlation between intron length and mean SEF. (C) Mean SEF of seven pairs of paralogs. Paralogs with shorter intron length (IL) have higher SEF. (D) Negative correlation between 3′SS score (see Methods) and mean SEF. The score expresses how similar the splice sites are to the budding yeast 3′SS consensus. (E) Weak negative correlation between BP score and mean SEF. (F) Absence of correlation between delta G of BP-3′SS region and mean SEF. Delta G was divided by the distance between BP and 3′SS to achieve delta G per nucleotide (G) Sequence logos were generated for 5′SSs and 3′SSs of all novel alternative splicing events. For annotated introns, sequence logos were generated only from splice sites of transcripts that had novel alternative splicing events. (H) Correlation between observed and predicted SEF (as described in Methods).

