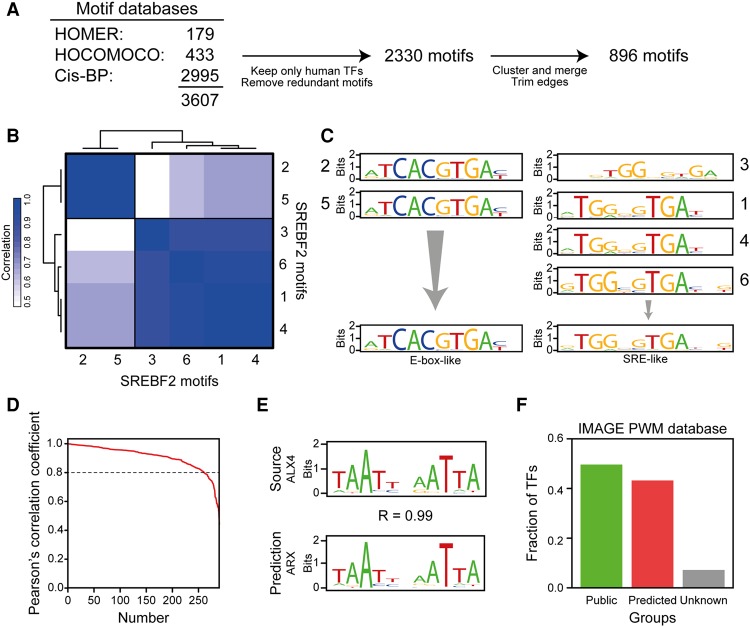
Figure 1.
Construction of an extended PWM database. (A) Several motif databases were collated in IMAGE. The databases (listed in the figure) were combined, and only nonredundant motifs assigned to human transcription factors were kept. All motifs for a given transcription factor were compared by correlation using HOMER (Heinz et al. 2010). The correlation matrices were clustered by hierarchical clustering, and clustered motifs were merged using MATLIGN (Kankainen and Löytynoja 2007). The edges of the merged motifs were trimmed using MotIV (Mercier et al. 2011), and only motifs with a length ≥4 bp after trimming were included. (B) SREBF2 motifs fall into two distinct clusters. The heat map shows the clustering of the motifs (indicated by numbers 1 through 6) mapped to SREBF2. (C) SREBF2 motifs that cluster together are very similar, and each cluster represents a unique binding specificity. Each SREBF2 motif was visualized using seqLogo (http://bioconductor.org/packages/release/bioc/html/seqLogo.html). Each group of motifs corresponds to a cluster. (D) Pearson's correlation coefficient for each transcription factor-motif pair, ordered by the correlation coefficient, between the known motifs of the transcription factors and the motif predicted by DNA-binding domain alignment. Motifs were compared using HOMER (Heinz et al. 2010). (E) Comparison of the experimentally determined motif for ALX homeobox 4 (ALX4) with the motif predicted based on DBD similarity, the aristaless related homeobox (ARX) motif. (F) IMAGE contains at least one motif for the vast majority of transcription factors. The bars show the fraction of human transcription factors in the IMAGE database that has a publicly available motif, a motif predicted by IMAGE, or no motif information.

