Figure 2.
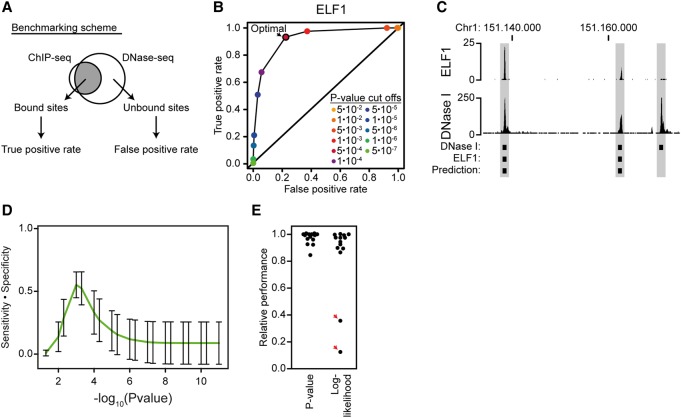
P-value-based threshold determination has a local maximum of sensitivity and specificity. (A) Scheme for benchmarking motif thresholds. Fourteen ENCODE ChIP-seq and DNase-seq data sets (The ENCODE Project Consortium 2012) from three different cell types were used to validate the P-value-based approach for cut-off determination by precision-recall statistics. Bound sites were defined as the top 5000 strongest sites in ChIP-seq. Unbound sites were defined as 20,000 random DNase I-sensitive sites that do not overlap a ChIP-seq peak. (B) Representative example of predictions across many cut-offs. The plot shows the true-positive rate and false-positive rate for motif-based prediction of ELF1 binding sites at 11 different P-value cut-offs. (C) Visualization of a representative region containing both positive and negative prediction. The screenshot was generated using the UCSC Genome Browser (Kent et al. 2002). It shows ELF1 binding sites (ChIP-seq), predicted ELF1 sites, and DNase-seq. (D) There is a local maximum in sensitivity multiplied by specificity using P-value-based PWM scoring. The line shows averaged prediction statistics across all 14 transcription factors (as indicated in A) at different P-value cut-offs. Error bars represent the standard deviation. (E) There are no outliers in relative performance for the P-value-based approach. The plot shows the predictive performance (sensitivity multiplied by specificity) of each of the 14 motifs that were calculated based on their P-value-based cut-offs and their log-likelihood-based cut-offs. The relative performance is the predictive performance at the local maximum for either P-value-based or log-likelihood-based cut-offs divided by the best predictive performance across all either P-value-based or log-likelihood-based cut-offs. The red arrows indicate factor predictions with low relative performance at the local maximum.

