Figure 4.
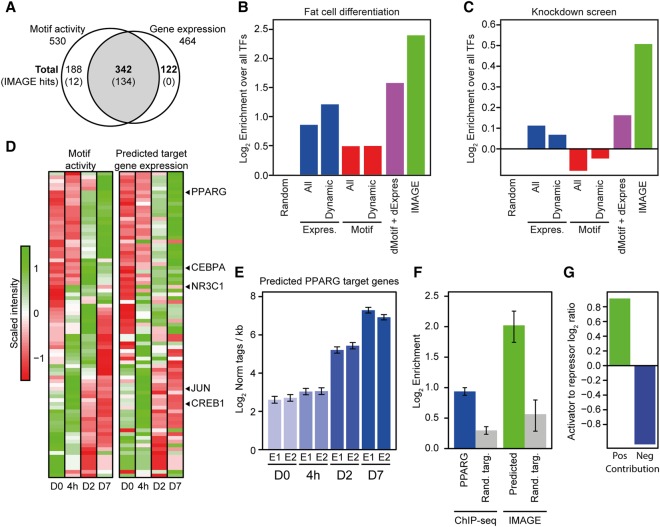
IMAGE identifies regulators of adipogenesis with high confidence. The predictive power of IMAGE for identification of important transcriptional regulators was investigated using previously published data from 3T3-L1 preadipocyte differentiation (Siersbaek et al. 2011, 2014, 2017). (A) IMAGE predicts causal regulators of 3T3-L1 adipocyte differentiation, including many that are not differentially expressed during differentiation. The Venn diagram shows the overlap between transcription factors with a significant change in IMAGE motif activity based on MED1 ChIP-seq (n = 2) and RNA-seq (n = 2) during 3T3-L1 adipogenesis, and transcription factors with a significant change in gene expression (RNA-seq, n = 2) at any point during differentiation. The numbers represent all transcription factors that have significant changes in motif activity and/or gene expression. Numbers in parentheses indicate the subset identified by IMAGE as high or medium confidence causal transcription factors. (B,C) Comparison of the predictive power of IMAGE and various other methods for predicting transcriptional regulators of adipogenesis previously defined as belonging to the GO term ‘fat cell differentiation’ (B), or previously identified in a knockdown screen to affect lipid accumulation during 3T3-L1 adipocyte differentiation (Söhle et al. 2012) (C). The bar plot shows the predictive power of the indicated methods as determined by the enrichment of the predicted factors over all transcription factors. The different methods compared with IMAGE are: (1) random selection (Random); (2) all expressed transcription factors (≥1 log2-transformed read per kilobase) (Expres., All); (3) all expressed and differentially expressed transcription factors (≥1 log2-transformed read per kilobase and Padj ≤ 0.05) (Expres., Dynamic); (4) all transcription factors whose motif is significantly enriched in MED1-bound enhancers compared to genomic background (Motif, All); (5) transcription factors whose motif is significantly enriched in differentially regulated enhancers (Padj ≤ 0.05) compared to genomic background (Motif, Dynamic); and (6) integration of the groups containing dynamically expressed transcription factors and transcription factors with motif enrichment in differentially regulated enhancers compared to genomic background (dMotif + dExpress). (D) Motif activities recapitulate the transcriptional waves during adipocyte differentiation in 3T3-L1 cells. Heat map of motif activity of all motifs with significant changes in motif activity during 3T3-L1 differentiation (left panel) and average expression of predicted target genes of these motifs (right panel) at the different time points following induction of differentiation, day 0, 4 h, and day 2 and day 7. (E) Example showing the average mRNA expression of genes predicted by IMAGE to be regulated by PPARG. Bar plot shows average gene expression for target genes of two replicates (E1 and E2) during 3T3-L1 differentiation. (F) Comparison of prediction of PPARG target genes based on IMAGE and based on PPARG ChIP-seq. The bar plot shows the enrichment of predicted PPARG target genes (predicted using either PPARG ChIP-seq data [Siersbaek et al. 2011] or IMAGE) among the group of PPARG-dependent genes (Schupp et al. 2009). PPARG-dependent genes are defined as genes significantly regulated during adipogenesis in 3T3-L1 control cells (Padj ≤ 0.01) but with at least twofold less repression or induction upon knockdown of PPARG in mature 3T3-L1 adipocytes. The enrichment of IMAGE-predicted or ChIP-seq-predicted (PPARG peak within ±25 kb of the transcription start site) target genes is calculated by comparing the fraction of predicted target genes that are experimentally defined as PPARG-dependent relative to a randomized control fraction using size-matched randomized groups of target genes and dependent genes. Background enrichment was estimated by 1000 permutations of randomizing the predicted target genes and calculating the same enrichment. The error bars indicate the standard deviation across 1000 permutations. (G) Motif activity can be used to distinguish between transcription activators and repressors. The bar plot shows the log2 ratio between the Jaccard similarity coefficient between motifs with significantly positive (P ≤ 0.05, motif activity ≥ 0.005) motif activity at day 7 of differentiation and transcription factors only marked as activators in the UniProt annotation, or motifs with significantly negative (P ≤ 0.05, motif activity ≤ −0.005) motif activity at day 7 of differentiation and transcription factors only marked as repressors in the UniProt annotation (Apweiler et al. 2004).

