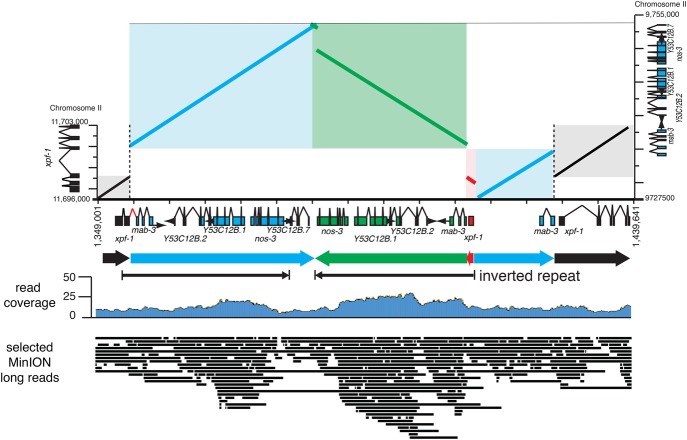
Figure 5.
Delineation of complex genome rearrangements. Schematic of the xpf-1(e1487) complex mutation in contig017. The left y-axis shows the wild-type xpf-1 gene structure and the right y-axis shows the mab-3 region. The mutation is a duplication and insertion of ∼20 kb of the mab-3 region in two segments into the second intron of xpf-1 (blue). The larger segment of the inserted region along with the flanking xpf-1 exon 2 has been duplicated creating an inverted repeat (green and red). Shown below is read coverage and selected MinION reads mapping to the region spanning the various breakpoints.

