Figure 6.
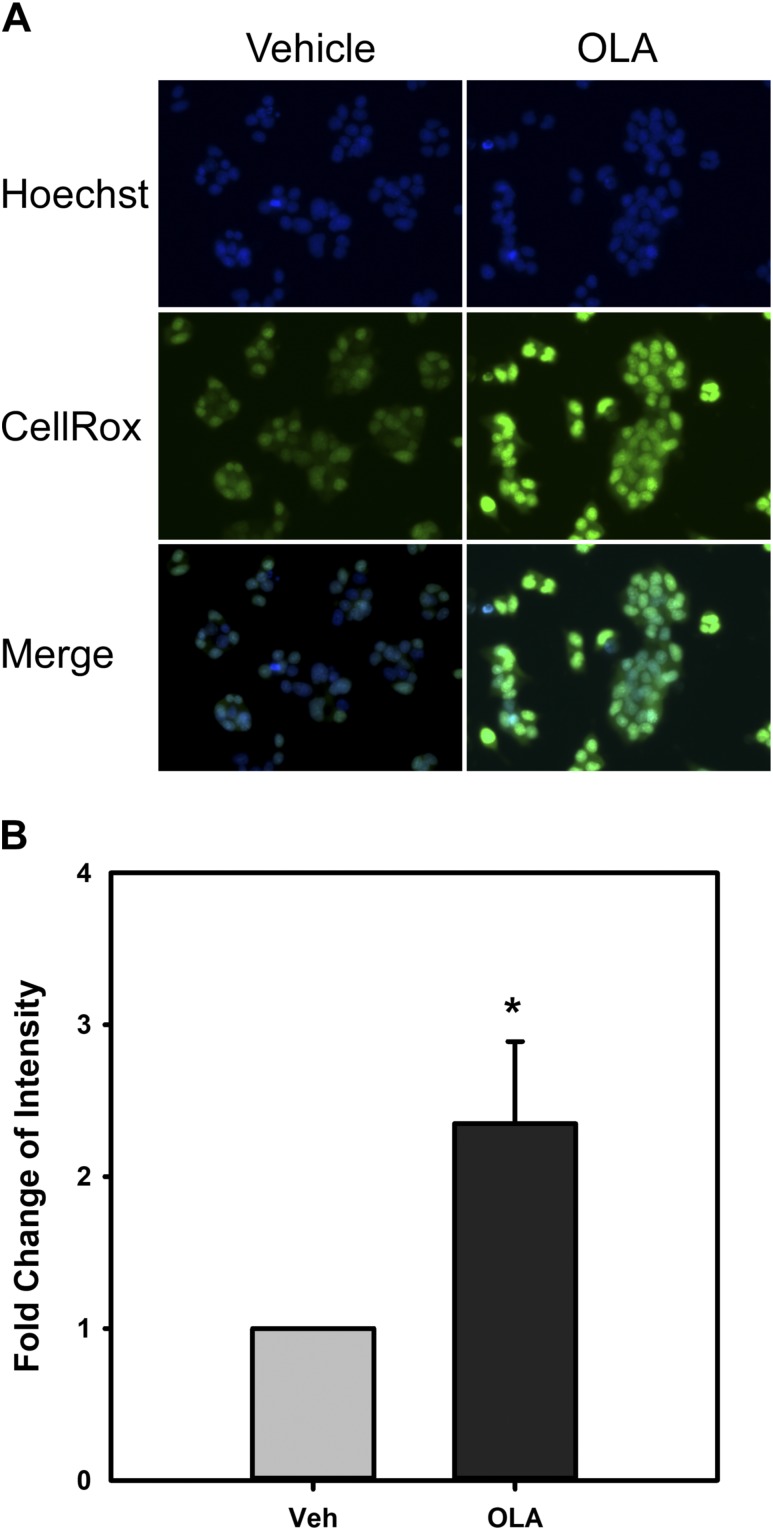
OLA induces ROS formation in LβT2 cells. LβT2 cells plated on poly-D-lysine–coated glass-bottom dishes were serum starved for 12 to 16 hours and then treated with vehicle or 500 μM OLA for 3 hours prior to loading with 5 μM CellROX Green reagent and Hoechst 33342. Cells were incubated for a further 15 minutes. Live cell images were captured as described in Materials and Methods. (A) Hoechst (blue) and CellROX Green (green) images individually and merged for both vehicle- and OLA-treated cells. (B) OLA treatment results in increased ROS production as measured by the relative intensity ratio between green and blue and normalized to vehicle (Veh) control. Error bars denote standard error of the mean of at least three independent experiments. *Significant difference from control by Student t test.

