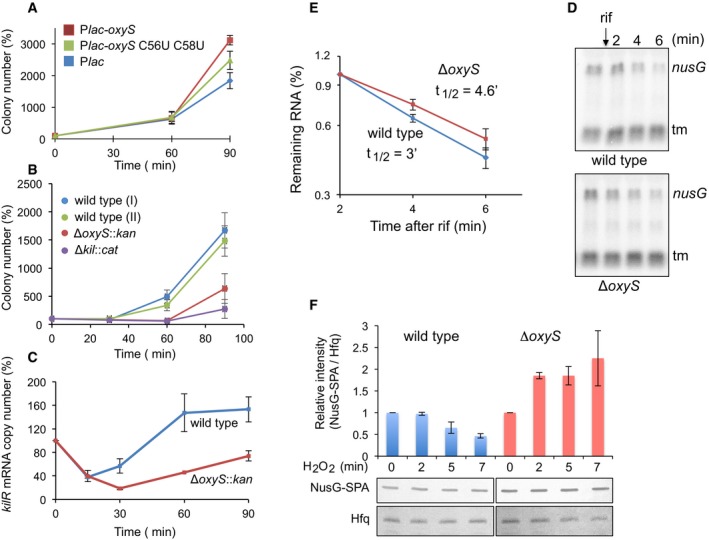
Figure 4. OxyS facilitates recovery from oxidative stress.

- OxyS toxicity facilitates recovery. Cultures (relA::cat ΔoxySli::kan, lacI q) with OxyS plasmids grown with IPTG (1 mM) were treated with 1 mM H2O2 at OD600 = 0.1 for 30 min. Thereafter, the cultures were washed and continued to grow in fresh LB medium. Samples were taken 30, 60, and 90 min after wash. The number of cells after wash was used as 100% reference. Results are displayed as mean of two biological experiments ± standard deviation.
- OxyS‐mediated recovery requires the function of KilR protein. Cultures as indicated were treated with H2O2 for 30 min and washed as described above. relA::cat (wild‐type I) and relA::kan (wild‐type II) were used as controls for ΔoxySli::kan and ΔkilR::cat, respectively. Results are displayed as mean of four biological experiments ± standard deviation.
- OxyS increases kilR mRNA levels in response to oxidative stress. RT–PCR of RNA samples taken at the indicated time points following exposure to 1 mM of H2O2. Two samples per treatment and two reactions per sample were analyzed. Results are displayed as mean of two biological experiments ± standard deviation. kilR initial levels detected in the absence of treatment were used as 100% reference.
- Northern analysis of secE‐nusG mRNA in wild type and oxyS mutant exposed to hydrogen peroxide prior to the addition of rifampicin (rif).
- Calculated half‐life of nusG mRNA in wild type and oxyS mutant following exposure to H2O2. Average and standard deviations of two biological experiments are shown.
- OxyS decreases NusG‐SPA protein levels in response to oxidative stress. Wild‐type and oxyS mutant cells carrying NusG‐SPA were exposed to 1 mM H2O2. Protein samples taken at the indicated time points were analyzed using SPA‐specific antibodies. The intensities of NusG‐SPA and Hfq (serving as a loading control) were measured using Image Studio Lite program. Relative intensity was calculated using NusG‐SPA initial levels (in the absence of treatment) as 100% reference. Standard deviations of two biological experiments are shown.
Source data are available online for this figure.
