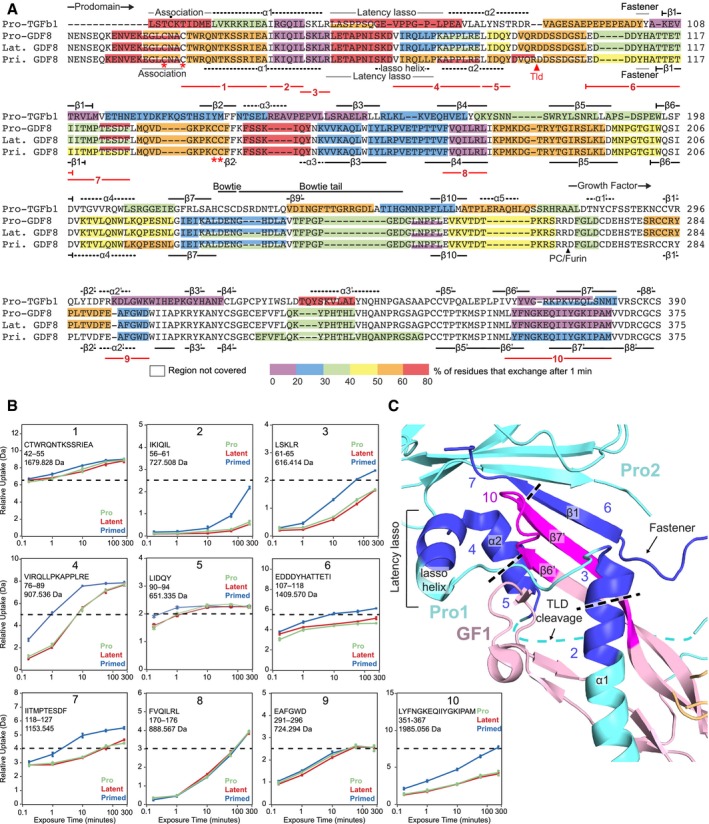
Figure 3. HDX‐MS of GDF8 pro‐complexes at pD 7.5.

- HDX of GDF8 pro‐complexes compared to pro‐TGF‐β1 R249A. The color (according to the scale shown) represents the percentage of deuterium incorporation for each peptide after 1 min in deuterium and is superimposed onto a structure‐based sequence alignment of TGF‐β1 R249A and GDF8. Secondary structures based on the pro‐TGF‐β1 and pro‐GDF8 crystal structure are shown above and below the sequences, respectively. PC/furin and TLD cleavage sites are indicated by arrowheads. Dot (•) marks the Cys4 residue in pro‐TGF‐β1 that disulfide links to LTBPs and GARP. Asterisks (*) mark cysteines in the GDF8 prodomain that are discussed in the text. Numbered lines below the alignment represent peptides 1–10 followed by HDX‐MS from pro‐, latent, and primed GDF8 samples that are compared in the text and in panels (B and C).
- Deuterium incorporation graphs for peptic peptides 1–10 from pro‐, latent, and primed GDF8. Values represent the mean of three independent measurements; error bars, s.d.
- Peptides that reveal enhanced HDX in primed GDF8 were mapped onto the corresponding regions in the pro‐GDF8 crystal structure (pdb: 5NTU), which include the prodomain α1‐helix, lasso helix, fastener, and β1‐strand and the growth factor β6′‐ and β7′‐strands. Prodomain monomers 1 and 2 (Pro1 and Pro2) are in cyan, and growth factor monomer 1 (GF1) is in light pink. Peptides with enhanced HDX are numbered and colored blue in Pro1 and Pro2 and magenta in GF2.
