-
A
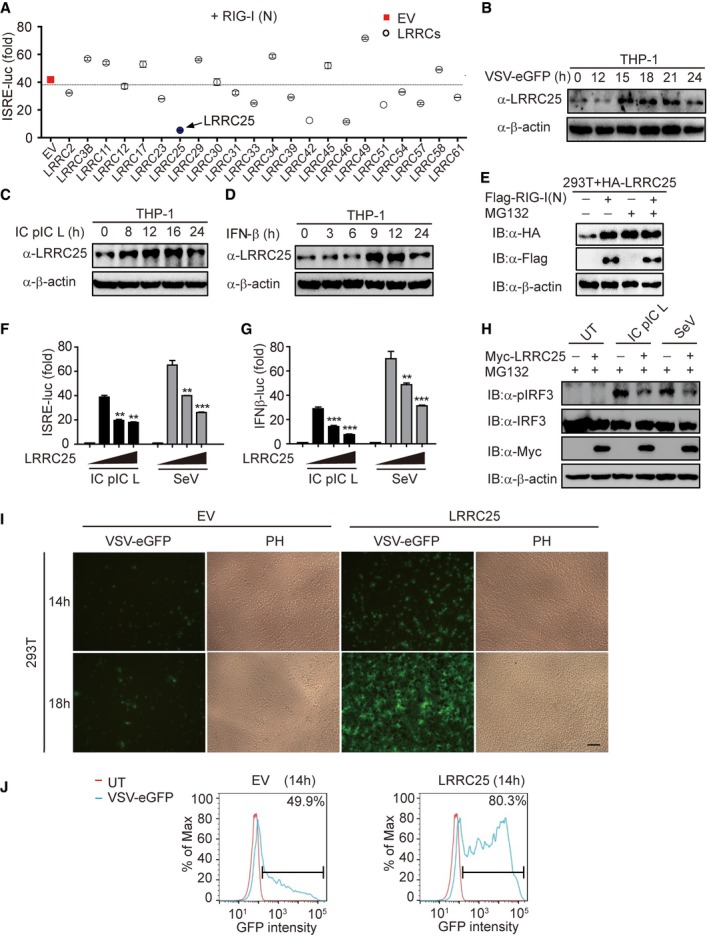
HEK293T cells were transfected with a control plasmid or plasmids expressing 22 LRRCs along with RIG‐I (N) and a reporter plasmid carrying the ISRE promoter (ISRE‐Luc). 24 h after transfection, cells were analyzed for ISRE‐luc activity.
-
B–D
THP‐1 cells were treated with VSV‐eGFP (MOI = 0.1), intracellular (IC) poly(I:C) low molecular weight (5 μg/ml), or IFN‐β (10 ng/ml) for indicated time points. Cell lysates were used for immunoblot analysis with the indicated antibodies.
-
E
HEK293T cells were transfected with plasmids for LRRC25, together with an empty vector or RIG‐I (N) for 24 h. Before harvesting, the cells were treated with DMSO or MG132 (5 μM) for 4 h. Cell lysates were used for immunoblot analysis with the indicated antibodies.
-
F, G
HEK293T cells were transfected with plasmids for Myc‐LRRC25, plus an ISRE‐luc (F) or an IFN‐β‐luc (G) reporter plasmid. After 12 h, cells were treated with IC poly(I:C) LMW (5 μg/ml) or SeV (MOI = 0.1) for 24 h or 14 h, respectively, and analyzed for ISRE‐luc and IFN‐β‐luc activity.
-
H
HEK293T cells were transfected with an empty vector or Myc‐LRRC25. After 12 h, cells were left untreated or treated with IC poly(I:C) LMW (5 μg/ml) or SeV (MOI = 0.1) for 24 h or 14 h, respectively. Before harvesting, the cells were treated with MG132 (5 μM) for 4 h. Protein extracts were analyzed by immunoblot using the indicated antibodies.
-
I
HEK293T cells were transfected with an empty vector (EV) or Myc‐LRRC25. 24 h post‐transfection, cells were infected with VSV‐eGFP (MOI = 0.001) for the indicated time points and subjected to phase‐contrast (PH) and fluorescence microscopy analyses. Scale bar, 80 μm.
-
J
Flow cytometry analyses of 293T cells in (I). Numbers at the top‐right corner indicate the percentage of cells expressing eGFP. Bar: population of GFP‐positive cells.
Data information: In (B–E, H–J), data are representative of three independent experiments. In (A, F, G), data are mean values ± SEM (
= 3). **
‐test).