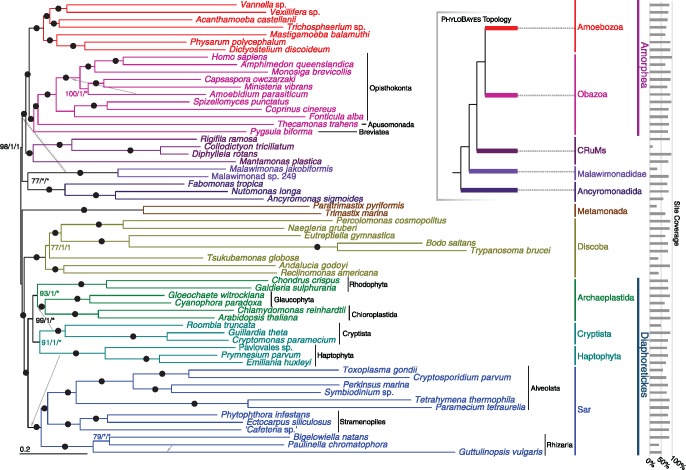
Fig. 1.
—Phylogenetic tree for 61 eukaryotes, inferred from 351 proteins using Maximum Likelihood (LG + C60 + F+Γ-PMSF model). The numbers on branches show (in order) support values from 100 real bootstrap replicates (LG + C60 + F+Γ-PMSF model) and posterior probabilities from both sets of converged chains in Phylobayes-MPI under CAT-GTR+Γ model (i.e., MLBS/PP/PP). Filled circles represent maximum support with all methods; asterisks indicate a clade not recovered in the Phylobayes analysis. The dashed arrow indicates the placement of malawimonads inferred with Phylobayes-MPI (see also inset summary tree), and gray arrows indicate the placements of other lineages in the Phylobayes-MPI analyses.

