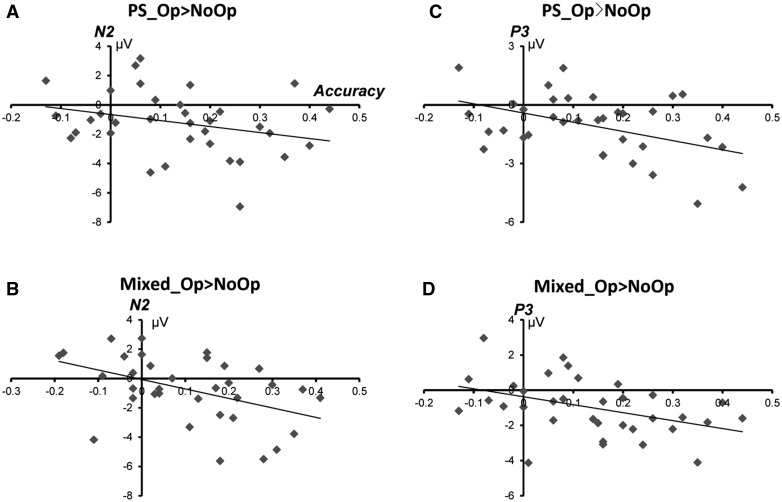
Fig. 4.
Correlation between ERP components and accuracy rates. The horizontal axis is the reported accuracy of Op–NoOp(0–1) and the longitudinal axis is the mean amplidtude of Op–NoOp (µV). (A) N2_(PS_Op > PS_NoOp) and accuracy_(PS_Op > PS_NoOp); (B) N2_(mixed_Op > mixed_NoOp) and accuracy_(mixed_Op > mixed_NoOp); (C) P3_(PS_Op > PS_NoOp) and accuracy_(PS_Op > PS_NoOp); (D) P3_(mixed_Op > mixed_NoOp) and accuracy_(mixed_Op > mixed_NoOp).

