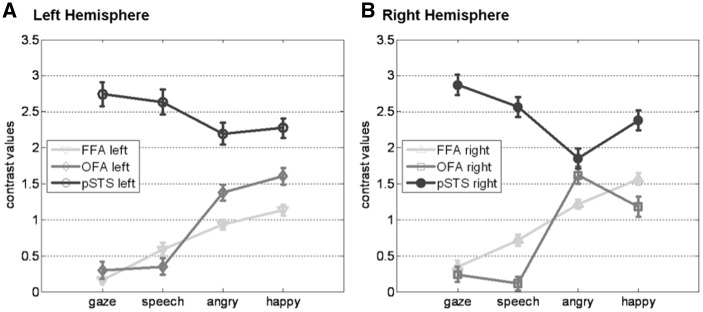
Fig. 2.
Activation to emotional and non-emotional stimuli in the face perception network. Plotted are the mean contrast values with standard errors resulting from RFX group analyses of dynamic faces (angry, happy, gaze and speech) vs static faces (neutral face with static or moving background). Each line represents average values from a ROI (light gray—FFA, middle gray—OFA and dark gray—pSTS,) in the LH (A) and RH (B).

