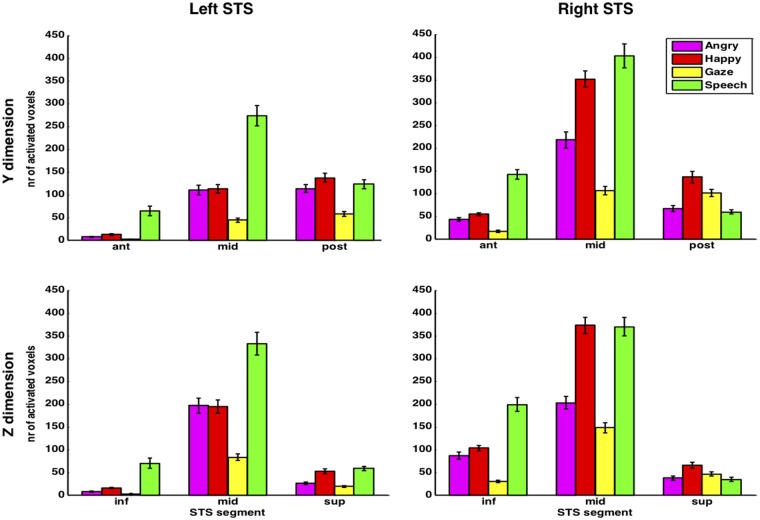
Fig. 4.
Spatial distribution of activation in STS. The number of activated voxels is plotted for different segments of left and right STS (first and second columns, respectively). The three segments were obtained by parcellating each subject’s STS into three equal parts along either the y axis (anterior to posterior; first row) or the z axis (inferior to superior; second row). Bars represent the group mean; error bars are the SEM. Statistical comparisons are reported in Supplementary Table S1. Magenta bars = angry, red = happy, yellow = gaze and green = speech.

