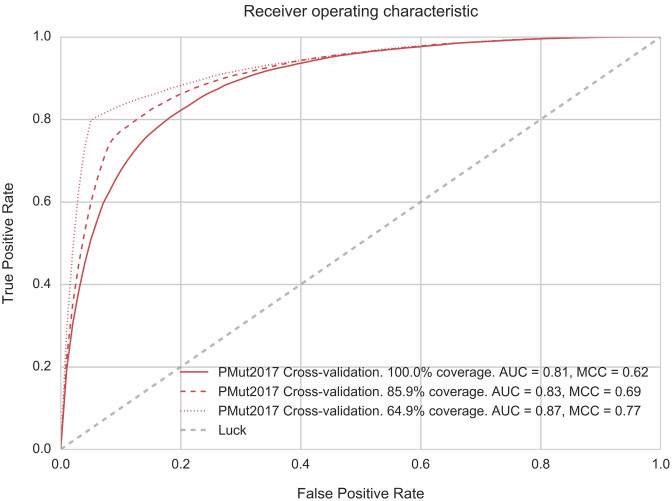
Figure 1.
ROC Curves corresponding to PMut2017 10-fold cross-validation based on protein families. No sequence in the validation set has more than 50% identity with sequences in the training set. Additional curves correspond to the subsets of prediction with 85% and 90% confidence. AUC: area under the curve, MCC: Matthews Correlation Coefficient.

