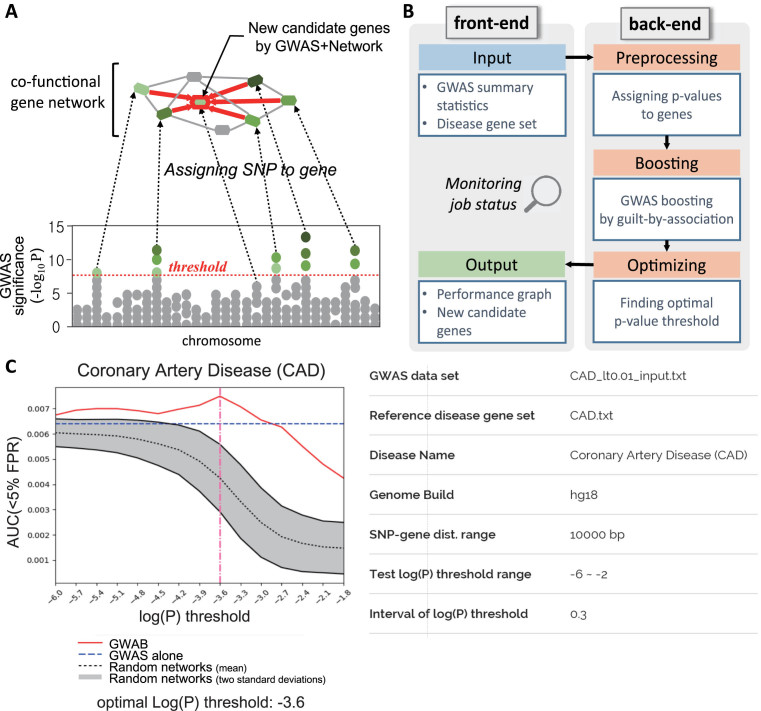
Figure 1.
Overview of GWAB. (A) Schematic summary of the network-based boosting of GWAS data. (B) Components of the GWAS web service and their work flow. (C) A summary plot of GWAB results for the coronary artery disease GWAS data. The prediction performances for reference disease genes by GWAB, GWAS alone and 100 randomized networks are represented as AUC scores for FPR 5% (y-axis) for the given log(P) threshold (x-axis). The vertical dashed line indicates the optimal log(P) threshold where the best AUC score was achieved.

