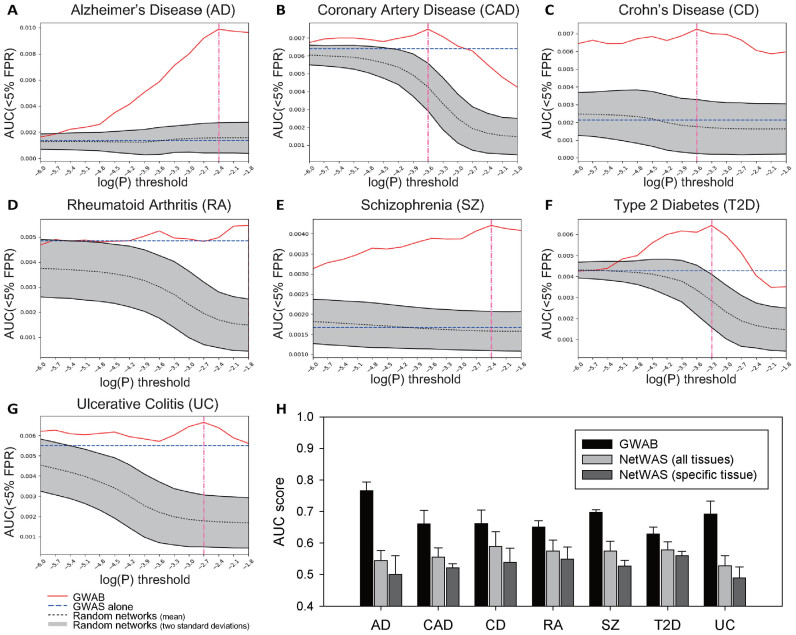
Figure 2.
Evaluation of GWAB using seven disease GWAS. Summary plots of GWAB analyses for (A) Alzheimer's disease (ALZ), (B) coronary artery disease (CAD), (C) Crohn's disease (CD), (D) rheumatoid arthritis (RA), (E) schizophrenia (SZ), (F) Type 2 Diabetes (T2D) and (G) ulcerative colitis (UC). (H) Bar graphs representing the AUC scores for disease gene predictions by GWAB, NetWAS with all tissues and NetWAS with specific tissue (brain for ALZ, heart for CAD, intestine for CD, bone for RA, brain for SZ, liver for T2D, intestine for UC).

