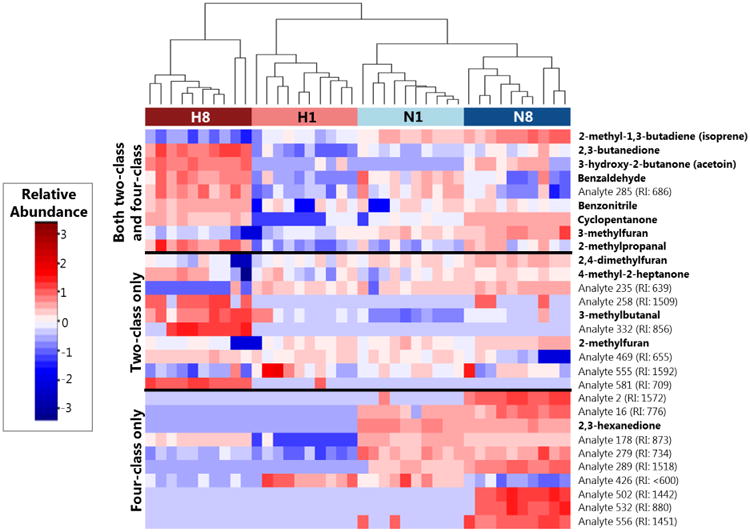
Figure 3.

Heat map depicting the relative abundance of discriminatory volatile molecules across samples from either late hypoxia (H8, dark red), early hypoxia (H1, light red), early normoxia (N1, light blue), or late normoxia (N8, dark blue) after log10-transformation, mean centering, and unit scaling. Molecules (rows) are divided into those that were identified in both the four-class and two-class RF models (top), the two-class model only (middle), or the four-class model only (bottom). Cell colors correspond to relative abundance of molecules across samples, ranging from low abundance (blue) to high abundance (red). Dendrogram was calculated using Euclidean distance as a measure of similarity between samples. “Analytes” correspond to molecules for which putative identifications could not be determined, and are accompanied by an experimentally-determined retention index (RI).
