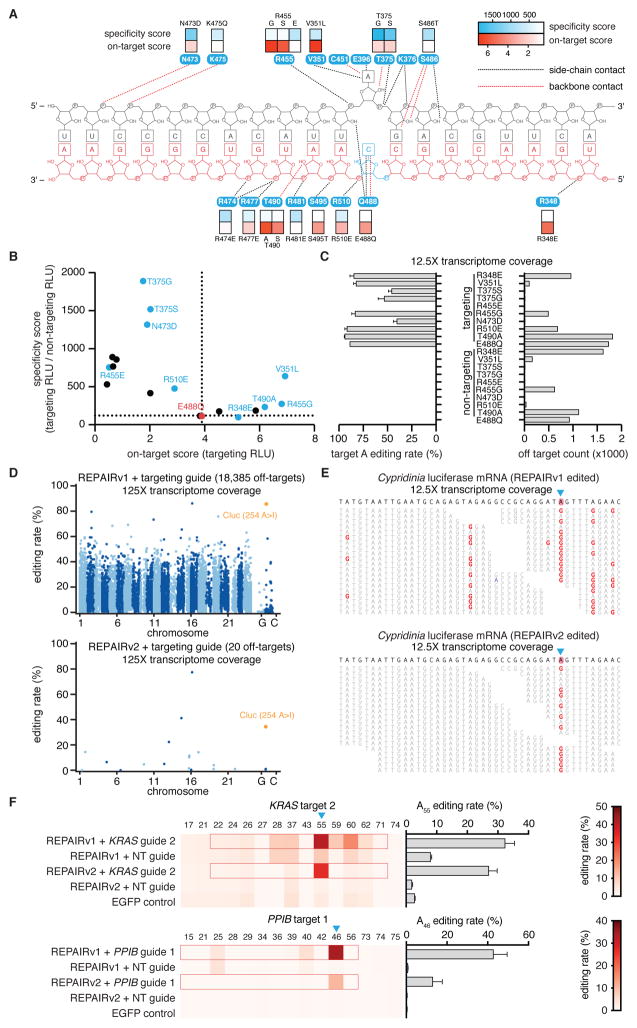
Figure 6. Rational mutagenesis of ADAR2 to improve the specificity of REPAIRv1.
A) Quantification of luciferase signal restoration (on-target score, red boxes) by various dCas13-ADAR2DD mutants as well as their specificity score (blue boxes) plotted along a schematic of the contacts between key ADAR2 deaminase residues and the dsRNA target (target strand shown in gray; the non-target strand is shown in red). All deaminase mutations were made on the dCas13-ADAR2DD(E488Q) background. The specificity score is defined as the ratio of the luciferase signal between targeting guide and non-targeting guide conditions. Schematic of ADAR2 deaminase domain contacts with dsRNA is adapted from ref (20).
B) Quantification of luciferase signal restoration by various dCas13-ADAR2 mutants versus their specificity score. Non-targeting guide is the same as in Fig. 2C.
C) Quantification of on-target editing and the number of significant off-targets for each dCas13-ADAR2DD(E488Q) mutant by transcriptome wide sequencing of mRNAs. Values represent mean +/− S.E.M. Non-targeting guide is the same as in Fig. 2C.
D) Transcriptome-wide sites of significant RNA editing by REPAIRv1 (top) and REPAIRv2 (bottom) with a guide targeting a pretermination site in Cluc. The on-target Cluc site (254 A>I) is highlighted in orange. 10 ng of REPAIR vector was transfected for each condition.
E) Representative RNA sequencing reads surrounding the on-target Cluc editing site (254 A>I; blue triangle) highlighting the differences in off-target editing between REPAIRv1 (top) and REPAIRv2 (bottom). A>I edits are highlighted in red; sequencing errors are highlighted in blue. Gaps reflect spaces between aligned reads. Non-targeting guide is the same as in Fig. 2C.
F) RNA editing by REPAIRv1 and REPAIRv2 with guides targeting an out-of-frame UAG site in the endogenous KRAS and PPIB transcripts. The on-target editing fraction is shown as a sideways bar chart on the right for each condition row. For each guide, the region of duplex RNA is outlined in red. Values represent mean +/− S.E.M. Non-targeting guide is the same as in Fig. 2C.

