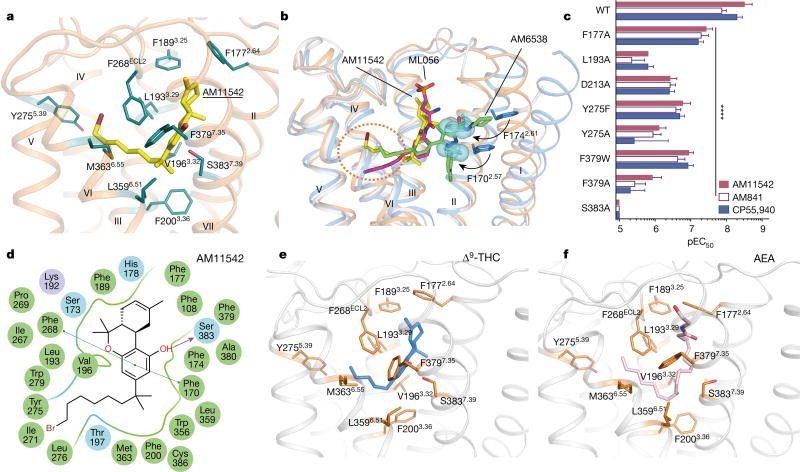
Figure 3. AM11542 binding pocket analysis and molecular docking of Δ9-THC and AEA.
a, Key residues (deepteal sticks) involved in AM11542 (yellow sticks) binding. b, Binding pose comparison of AM11542 (yellow), AM6538 (green) and ML056 (magenta) in their receptors, which are shown in orange, blue and grey cartoon, respectively. Phe1702.57 and Phe1742.61 in AM11542 and AM6538 complexes are shown in blue sphere and blue sticks, respectively. c, Certain mutations on CB1 significantly decreased potency in the cAMP assay compared to agonist-response at the wild-type (WT) receptor as determined by comparison of negative logarithm of the EC50 (pEC50) values by two-way analysis of variance (ANOVA) without repeated measures followed by Dunnett’s post hoc test (comparing each drug to its effect in the wild type: * * * * P < 0.0001, data are mean ± s.e.m., n ≥ 3) (Extended Data Table 2). d, Summary of receptor interactions of AM11542. Purple ball (positive charged interaction); cyan ball (polar interaction); green ball (hydrophobic interaction); purple arrow (H-bond); green line (π–π stacking) e, f, The docking pose of Δ9-THC (e, blue sticks) and AEA (f, pink sticks).

