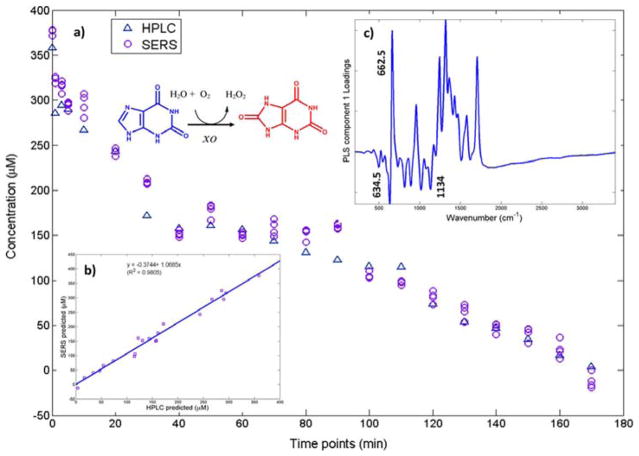
Figure 9.
(a) Partial least-squares regression results of SERS and HPLC concentration verses time results. Reaction present is xanthine to uric acid. (b) Plot of predicted SERS concentrations verses HPLC concentrations. (c) Partial least-squares loadings plot showing characteristics of the xanthine (662.5 cm−1) to uric acid (634.5 and 1134 cm−1) reaction. Reprinted with permission from Ref. 129. Copyright 2016 American Chemical Society.

