Figure 1.

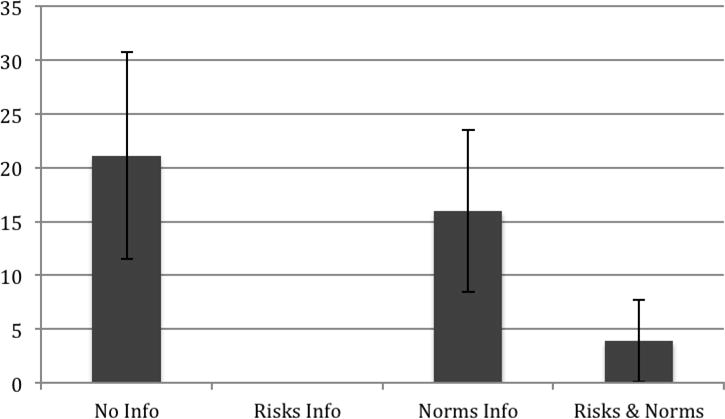
Percentage of participants who selected a sugar-sweetened soda, when offered a free beverage, as a function of information conditions. Note. Standard errors are represented by the error bars attached to each column.

Percentage of participants who selected a sugar-sweetened soda, when offered a free beverage, as a function of information conditions. Note. Standard errors are represented by the error bars attached to each column.