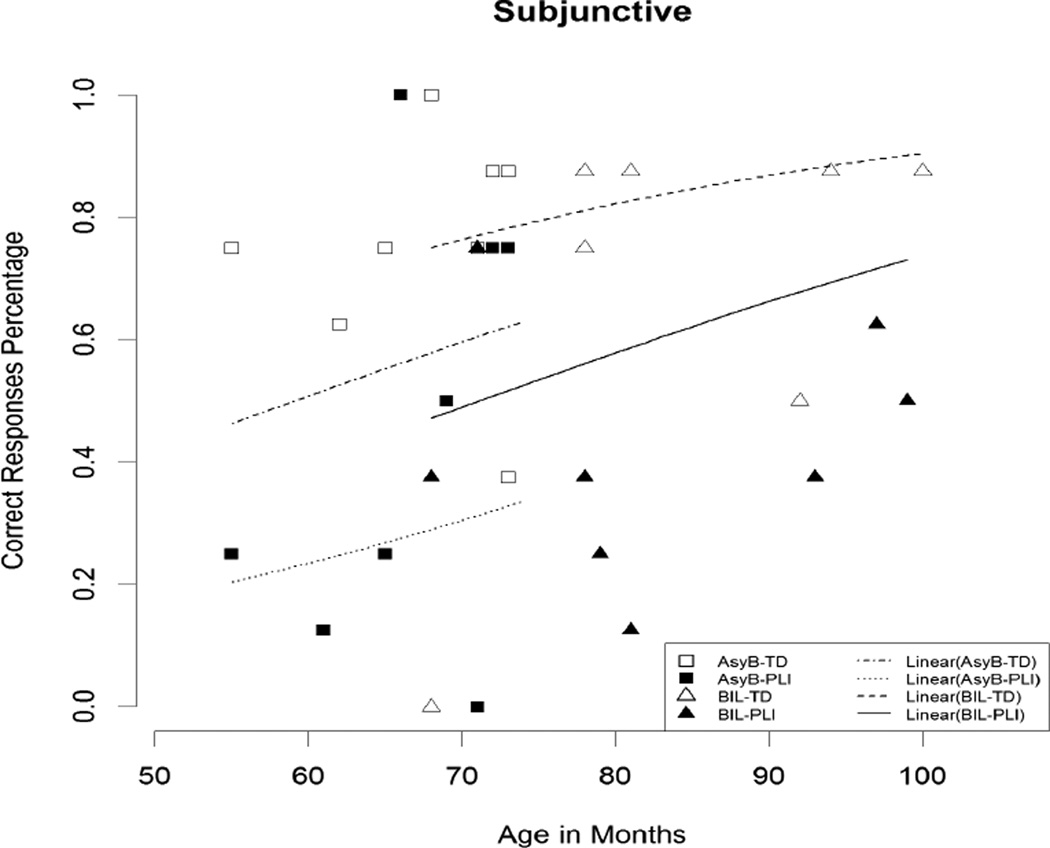
Figure 1.
Scatter and regression plot for correct response rates as a function of age for the subjunctive, grouped by different combinations of language impairment and bilingual status groups. Plotted points correspond to observed response percentages and are symbol coded according to subject language impairment and bilingual status. Plotted lines correspond to the predicted values obtained from the AIC optimal models identified in Table 4.

