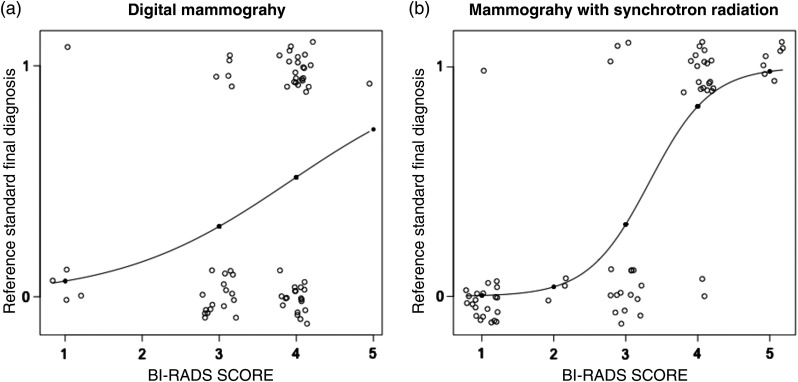
Fig. 3.
GLM applied to (a) DM and (b) MSR: the abscissa shows the BI-RADS score evaluations while the ordinate shows the final diagnosis obtained with the reference standard (0 means negative and 1 means positive). The continuous lines on the graphs are the fitted-model line while the circles represent the single patient evaluations. The circles are spread on the graph for better visualization.

