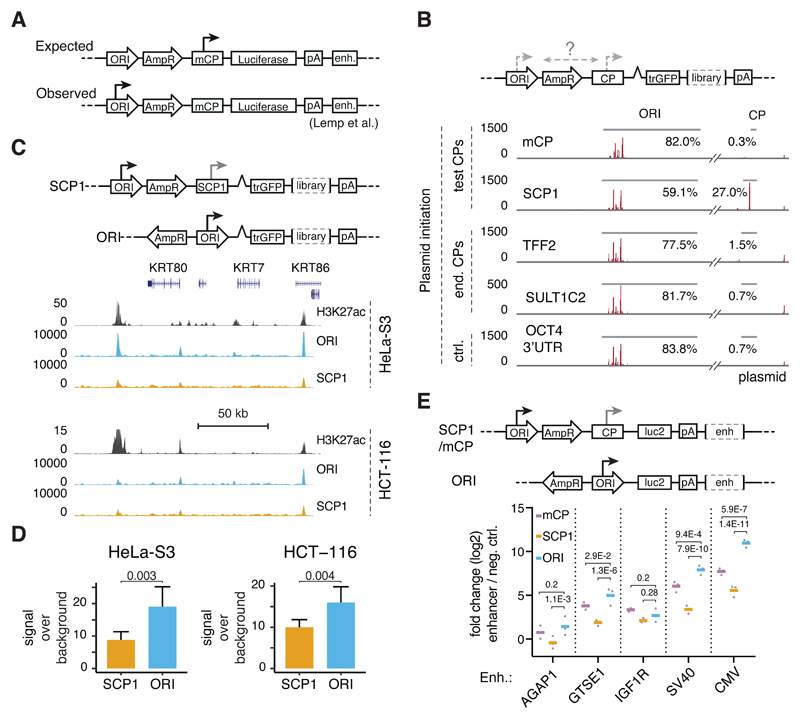
Figure 1. The ORI is an optimal core-promoter for STARR-seq and luciferase assays.
A, Typical layout of a reporter plasmid for enhancer-activity assays (e.g. pGL3/4) with the origin-of-replication (ORI), a resistance gene (AmpR), a minimal core-promoter (mCP), a reporter gene (Luciferase), a polyadenylation sequence (polyA) and an enhancer candidate (enh.). The major site of reporter-transcript initiation is indicated with an arrow (expected vs. observed according to Lemp et al.3). B, Reporter-transcript initiation on STARR-seq plasmids as measured by STAP-seq7 for setups with two synthetic core-promoters (mCP, SCP1) and two endogenous core-promoters (TTF2, SULT1C2) vs. a negative control (ctrl., OCT4 3’UTR). Red vertical lines indicate transcription initiation sites with the respective initiation frequencies according to STAP-seq. The percentages indicate the fraction of all initiation events in either the ORI or the respective core-promoter. C, Original and new setup of the STARR-seq plasmid (top) and STARR-seq profiles for screens using both setups in HeLa-S3 and HCT-116 cells (H3K27ac data from ENCODE and Rickels et al.47, see Supplementary Table 3) at a representative locus. D, STARR-seq signal-over-background between screens employing SCP1 or the ORI as a core-promoter over predicted enhancers for HeLa-S3 cells (n=39) or HCT-116 cells (n=27). Bars represent mean signal, error bars 75% confidence intervals, P-values as listed (two-sided paired t-test). See Supplementary Figure 1E,F,G for an equivalent analysis over luciferase validated regions in HeLa-S3 cells. E, Original and new setup of the luciferase plasmids (top) and average luciferase activity (bottom) for 3 cellular (AGAP1, GTSE1, IGF1R) and 2 viral (SV40, CMV) enhancers over a negative control (in log2 fold-change) in different reporter plasmid setups with the mCP (magenta), SCP1 (orange), and ORI (blue) as core-promoter. Bars represent mean signal across three independent transfections (grey dots), P-values as listed (two-sided Fisher’s LSD test).

