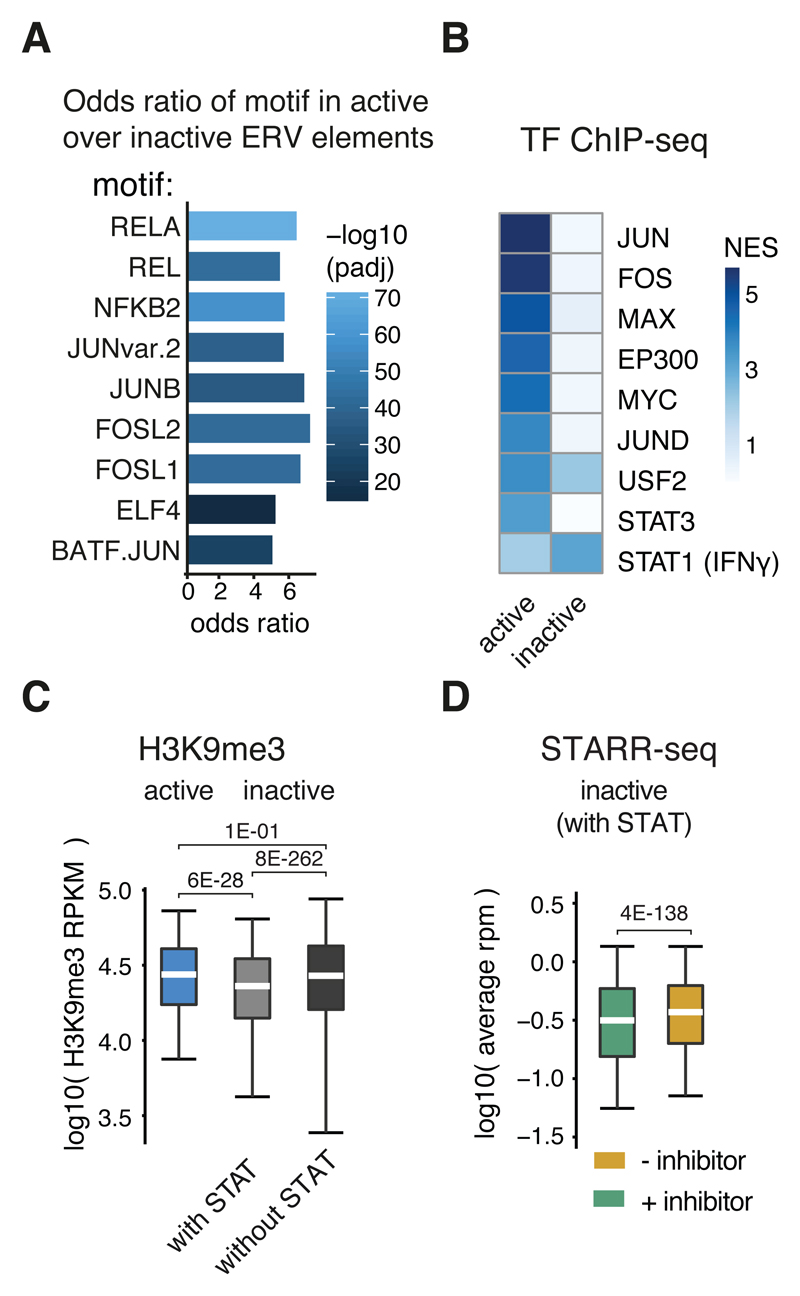
Figure 5. ERV elements are co-opted for IFN-I signaling.
A, Odds ratios (FDR-adjusted P-value < 0.05, two-sided Fisher’s exact test) of transcription factor motifs in active over inactive (based on STARR-seq signal) ERV elements from the three enriched ERV families (see panel G). B, i-cisTarget normalized enrichments scores for ENCODE ChIP-seq datasets within active or inactive ERV elements. C, Boxplot of H3K9me3 read coverage per kb (RPKM) in log10 over active (n=1783) or inactive ERV elements with (n=26809) or without (n=491157) STAT motifs. D, STARR-seq read coverage in log10 for STARR-seq screens with (green) or without (red) TBK1/IKK/PKR inhibition over inactive ERV elements with STAT motifs (n=26809). C,D: Lower whisker: 5th percentile, lower hinge: 25th percentile, median, upper hinge: 75th percentile, upper whisker: 95th percentile. P-values as stated (one-sided Wilcoxon rank sum test).

