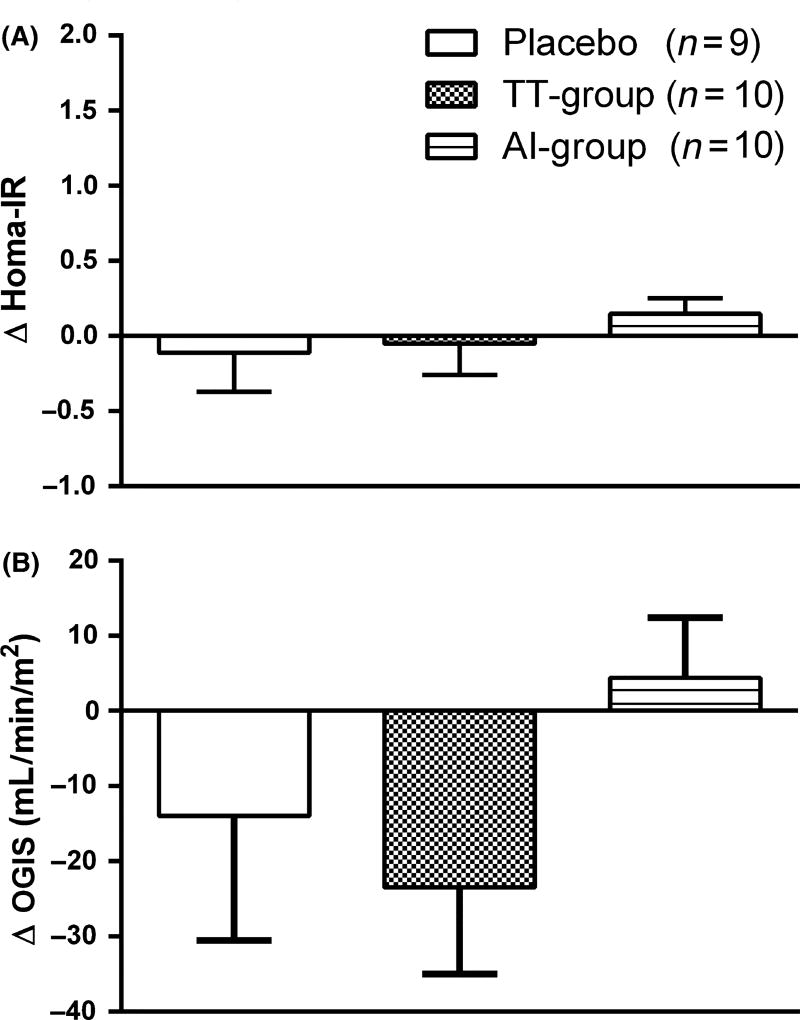
Figure 1.
Changes in homeostasis model assessment (A) and oral glucose insulin sensitivity (B) after 12 months of treatment. Data are presented as mean±sem. Between group comparisons were performed with anova (F-test) and within-group comparisons were performed with paired t-test. F-test (A) p = 0.62, (B) p = 0.31.

