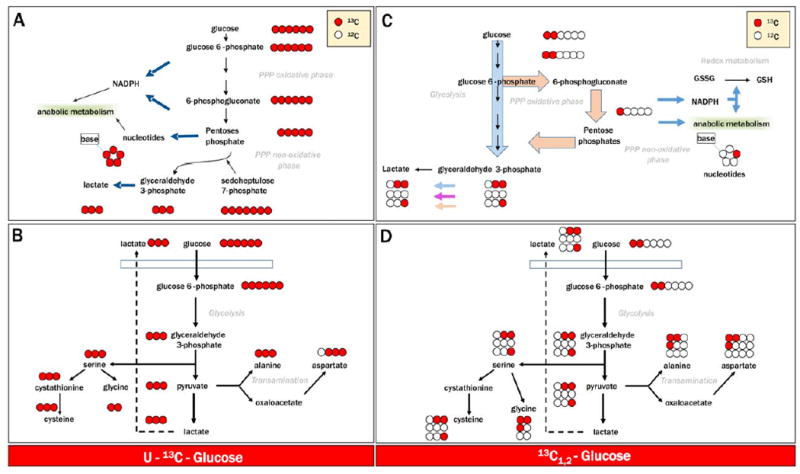
Fig. 2.

Flux balance analysis and tracing experiments upon incubation of blood cell products with heavy labeled substrates has been made amenable to routine analysis by the introduction of state-of-the-art NMR-50 and MS-based analytical technologies. Here we show four representative examples of isotopologue distributions upon labeling of glycolysis-pentose phosphate pathway and serine biosynthesis-transaminase activity pathway, after incubation of cells with uniformly labeled 13C1-6-glucose (A and B) or glucose labeled only at Carbon Positions 1 and 2 (13C1,2-glucose—C and D), respectively.
