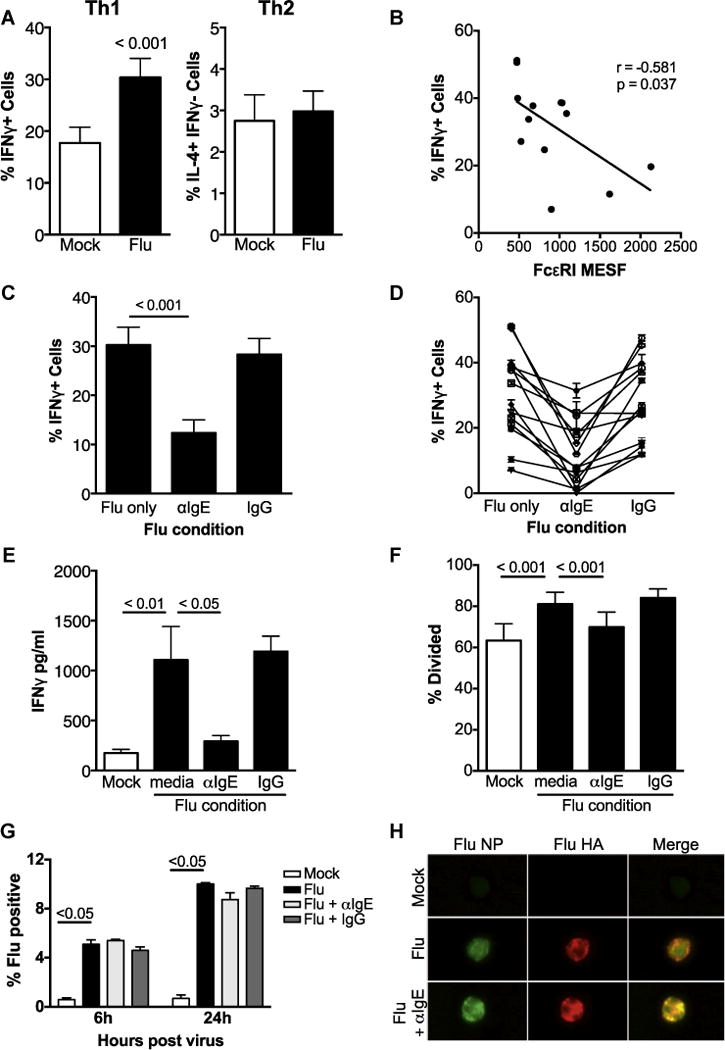
FIG 1.

IgE cross-linking inhibits virus-driven monocyte priming of TH1 cells. A, Naive CD4 T cells polarized with monocytes exposed to no virus (mock) or influenza A virus (Flu). B, Linear regression analysis was used to determine correlation between baseline monocyte FcεRI expression (x-axis) and TH1 priming capacity (%IFN-γ+ cells, y-axis) of influenza-exposed monocytes with P values and r2 values noted. N = 15. C and D, % IFN-γ+ T cells in monocyte-T-cell cocultures under IgE cross-linking conditions: (Fig 1, C) mean and (Fig 1, D) individual donor pairs. N = 15. E, Mean IFN-γ concentration in T-cell supernatants (N = 5). F, IgE cross-linking diminishes T-cell proliferation. Naive CD4 T cells labeled with VPD450 cellular dye before coculture. % divided defined as cells with lower VPD450 fluorescence compared with unstimulated T-cell controls, N = 3. Error bars represent the SEM. Pertinent P values are shown and were obtained with 2-way ANOVA analysis. G and H, Influenza A virus protein expression in monocytes at 6 and 24 hours postinfection by (Fig 1, G) flow cytometry of Flu-positive cells (NP/HA double positive) and (Fig 1, H) flow cytometry imaging at 6 hours postinfection (NP, green; HA, red). Shown is representative data from N = 3 experiments. HA, Influenza hemagglutinin; MESF, mean equivalent soluble fluorochrome; NP, influenza nucleoprotein. Error bars represent SEM, and P values represent results of 1-way ANOVA. All Material and Methods can be found in this article’s Online Repository at www.jacionline.org.
