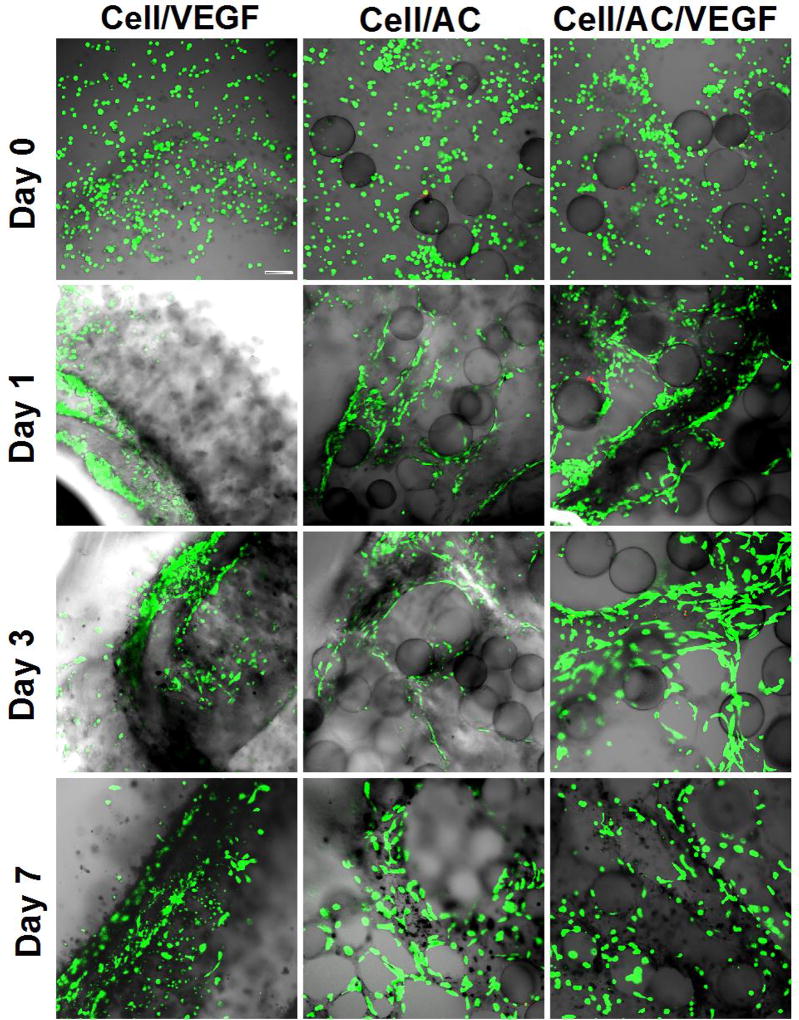
Fig. 3.
Confocal images of different samples at different time points. Microvascular structure formed within the samples with AC (alginate-chitosan) microcapsules. Staining of the cells: green for live cells (calcein) and red for dead cells (EthD-1). Cell: HUVEC-CS and AC: AC microcapsule. Scale bar: 100 µm.

