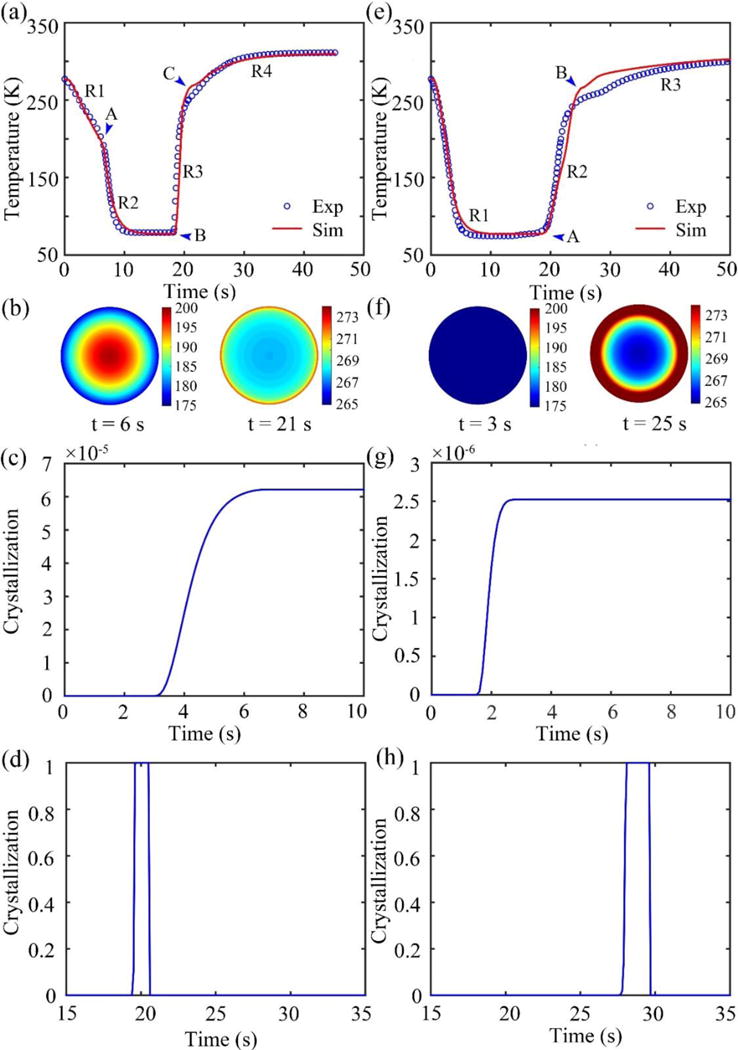
Figure 2.

The results of noncellular experiments. (a), (e) The recorded temperature variations (blue circles) and corresponding fitting results (red line). (b), (f) Temperature contour of the cross section. (c), (g) Simulated crystallization curves during cooling. (d), (h) Simulative crystallization curves during warming. (a)–(d) correspond to the ‘NG’ group. (e)–(h) correspond to the ‘WG’ group.
