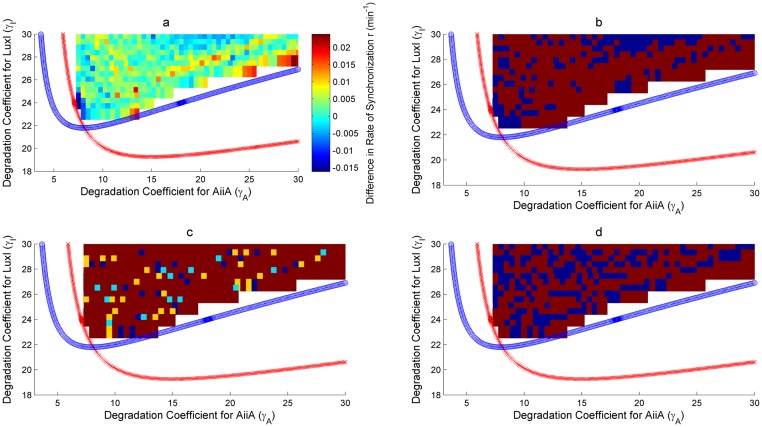
Fig 9. Robustness analysis for Rate of Synchronization (r) in the γI-γA parameter space.
Robustness analysis with respect to Rate of Synchronization (r). Two parameter bifurcation plots are presented for HOTFM and the Danino oscillators in the γI-γA parameter space for r. The blue (red) curve respresents the hopf branch for HOTFM (Danino). Region above the hopf branch corresponds to parameter values where oscillations occur, while for regions below the hopf branch oscillation dies and steady state solution arises. For a comparative analysis of robustness between HOTFM and Danino we consider 520 points in the region of oscillations common to both HOTFM and Danino. At each point the system of equations (containing a linear array of 6 cells for both HOTFM and Danino) is numerically integrated for 500 minutes. From the obtained solutions r is calculated. For points which have rDanino − rHOTFM < 0, HOTFM is more robust compared to Danino, while for rDanino − rHOTFM > 0 Danino is more robust. a) Heatmap representing rDanino − rHOTFM at the 520 points in the oscillatory region common between HOTFM and Danino. Negative values suggest that HOTFM is more robust for r compared to Danino and vice versa. b) Heatmap for part a. thresholded at the value 0. Regions with negative values in a. have dark red color here, while regions with positive values in a. are colored blue. c) Heatmap for the effect sizes for individual points calculated using bootstrap estimates for the distribution for rDanino − rHOTFM Robustness Analysis for Rate of Synchronization (r). If rDanino − rHOTFM < 0, effect size is reported for greater robustness of HOTFM, while if rDanino − rHOTFM > 0, effect size (cohen’s d) is reported for greater robustness of Danino. The color scheme is as follows—Blue (negligible effect, d < 0.2), Cyan (small effect, 0.2 ≤ d < 0.5), Yellow (medium effect, 0.5 ≤ d < 0.8) and Dark Red (large effect, d ≥ 0.8). d) Heatmap for the presence or absence of 0 in the 95% bootstrapped confidence interval. Dark red means absence of 0 while blue represents presence.

