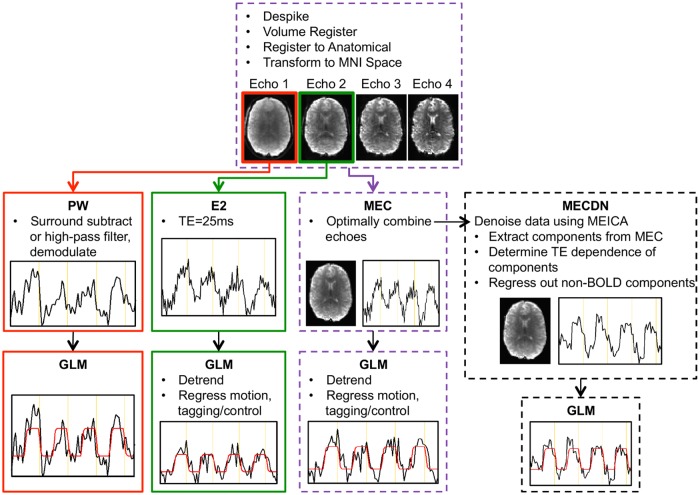
Fig 2. Schematic showing the processing pipeline for the ASL and BOLD echoes.
The first and second echoes were processed separately to yield the PWnone and E2 data, respectively. Echoes were combined using a T2*-weighted approach to generate the MEC dataset. This dataset was further denoised using MEICA, resulting in the MECDN dataset. No additional regression was performed in the GLM for the PW and MECDN datasets. Example activation curves and model fits are shown for the different datasets.

