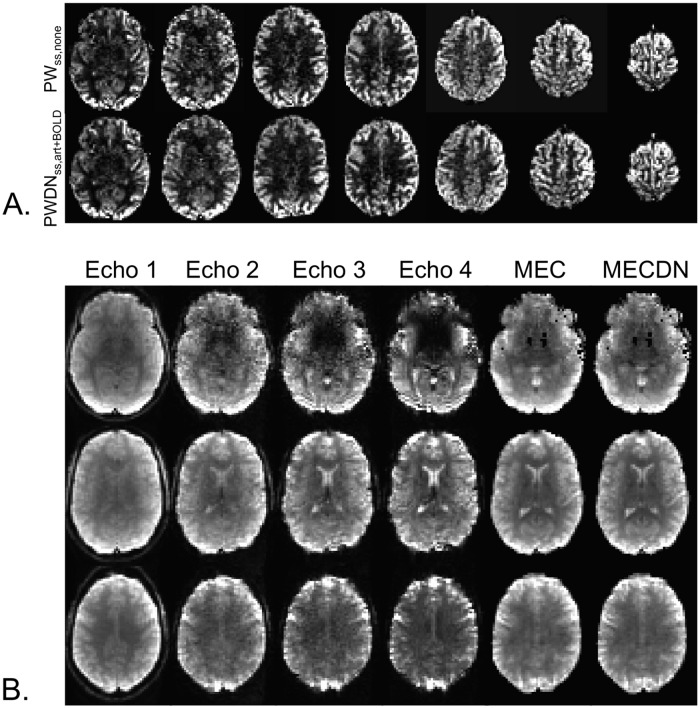
Fig 4. Representative PW and BOLD datasets.
(A) Mean PWss,none (top) and PWDNss,art+BOLD data (bottom) images. These images were created by averaging and subtracting the label images from the control images. MB imaging allows for the collection of whole-brain images in a relatively short readout time reducing T1 effects. (B) Example individual echo, MEC, and MECDN images from a single time point from one subject. Image quality improves with echo combination.

