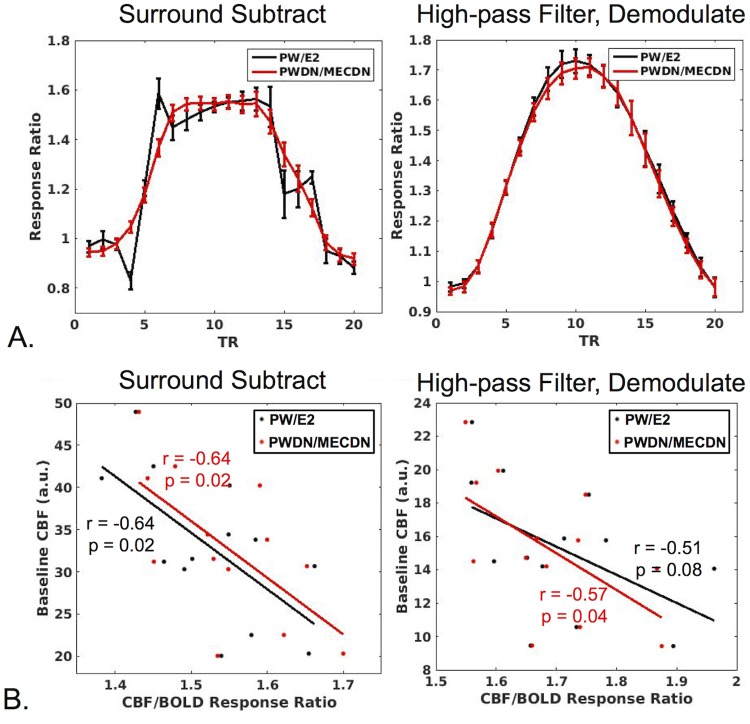
Fig 8. CBF/BOLD relationship.
(A) The mean ratio of CBF to BOLD signal is plotted across subjects in active voxels (CBF/BOLD response ratio) for SS (left) and HD data (right). The response ratio was examined for non-denoised (PW/E2) and denoised data (PWDN/MECDN). No significant difference was observed between the non-denoised and denoised response ratios averaged across the middle five activation TRs (TR #s 8–12). (B) CBF/BOLD response ratio plotted against baseline CBF for SS (left) and HD data (right). A significant negative correlation was observed between the CBF/BOLD ratio and mean baseline CBF for all processing schemes except for HD, PW/E2 which trended toward significance.

