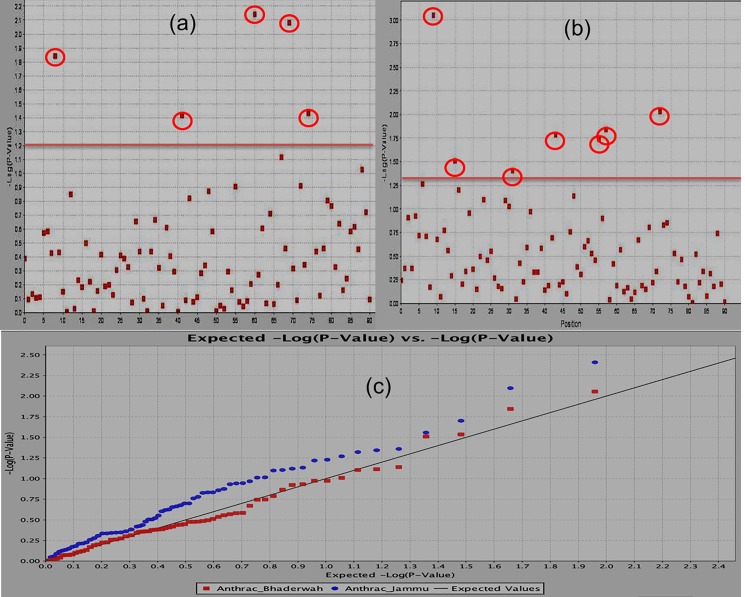
Fig 2. Manhattan plot showing significant MTAs identified using GLM approach of software program TASSEL for Anthracnose resistance.
(a) Shows MTAs identified from the phenotypic data recorded at Bhaderwah-Jammu, (b) shows MTAs identified from the phenotypic data recorded at SKUAST- Jammu and (c) shows the QQ plots for both locations (SKUAST-Jammu and Bhaderwah Jammu.

