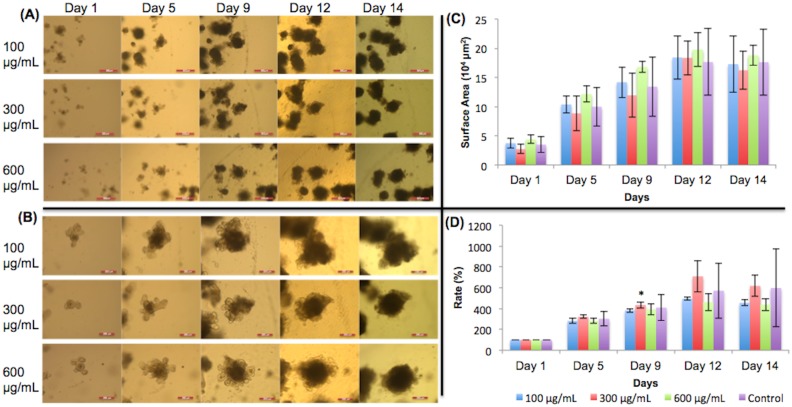
Fig 5. Chlorogenic acid treated organoid growth patterns.
The surface areas of three organoids were measured for each concentration in each day. (A) 5X magnification of organoids given chlorogenic acid. Day 9 –day 14 show organoids with added dietary constituent. Scale bar: 500 μm. (B) 10X magnification. Day 9 –day 14 show organoids with added dietary constituent. Scale bar: 200 μm. (C) Surface area of organoids. (D) Surface area expansion rate of organoids. There was a significant change in growth on Day 9 for 300 μg/mL organoids. However, this change was not observed after Day 9 in any of the concentrations. Significance values were calculated using unpaired, two-tailed Student’s t-test with n = 3. *p<0.05.

