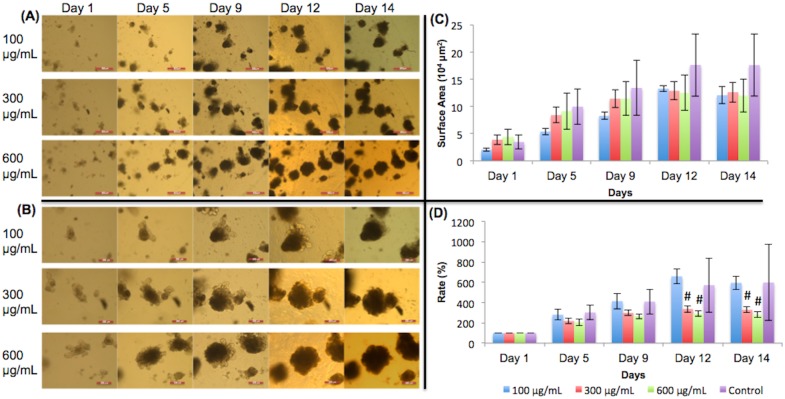
Fig 6. Caffeic acid treated organoid growth patterns.
(A) 5X magnification of organoids given caffeic acid. Day 9 –day 14 show organoids with added dietary constituent. Scale bar: 500 μm. (B) 10X magnification. Day 9 –day 14 show organoids with added dietary constituent. Scale bar: 200 μm. (C) Surface area of organoids. (D) Surface area expansion rate of organoids. Organoid growths were inhibited significantly by 300 and 600 μg/mL caffeic acid on days 12 and day 14 when compared to the 100 μg/mL organoids. These results are similar to those of Prasad et al. (2011), where caffeic acid’s effects on cancerous cells were studied. Caffeic acid may have inhibited growth by increasing the cytotoxicity in the environment. Significance values were calculated using unpaired, two-tailed Student’s t-test with n = 3. *p<0.05. #p value < 0.05 when 300 and 600 μg/mL were compared to 100 μg/mL in a t-test.

