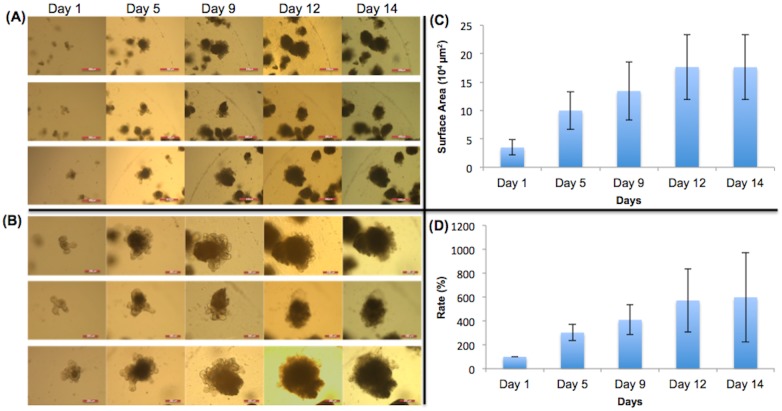
Fig 10. Control group of organoids.
(A) 5X magnification of organoids given no dietary constituents at all during the experiment. Scale bar: 500 μm. (B) 10X magnification. No dietary constituents added during the duration of the experiment. Scale bar: 200 μm. (C) Surface area of organoids. (D) Surface area expansion rate of organoids. The organoids crypts proliferated, expanded, and became denser, increasing the sizes of the organoids.

