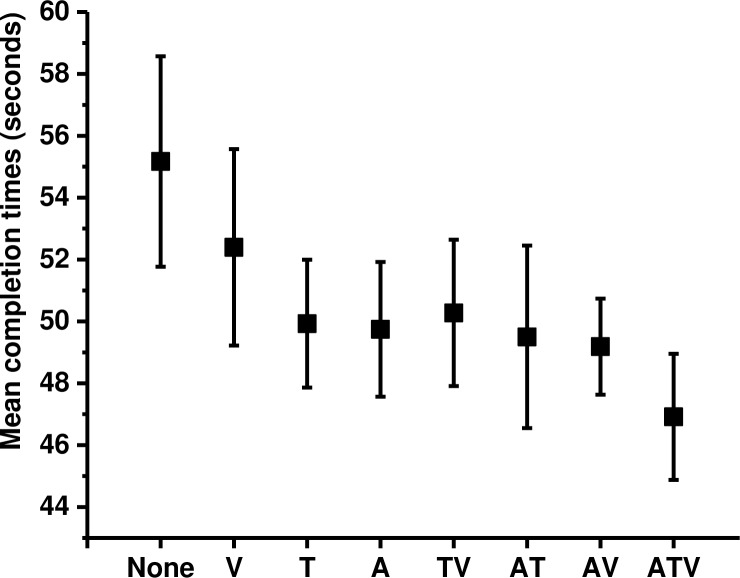
Fig 3. Objective performance data.
Means and standard errors in each condition for mean completion times. Participants were asked to perform the task as fast as they can; therefore shorter completion times indicate better performance. The data indicate that as the amount of sensory cues in the simulation increased, the task was completed faster.

