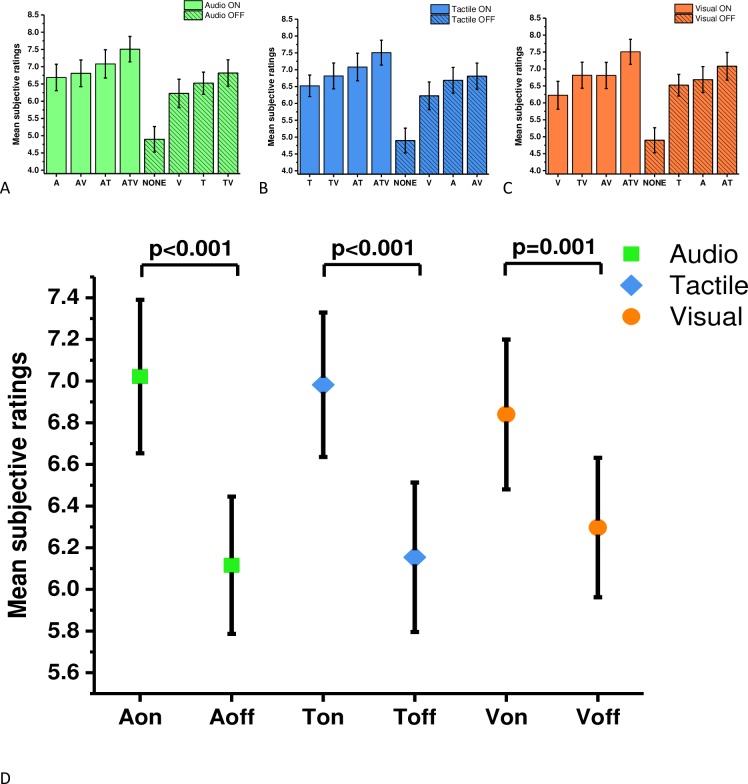
Fig 7. Subjective ratings for each sensory cue.
The means and standard errors for subjective ratings of presence: (A) audio, (B) tactile and (C) visual cues. Panel A, B and C shows the same data as panel D, however they are in a different order to aid a visual comparison. Significant effects in all three sensory modalities were found (D).

