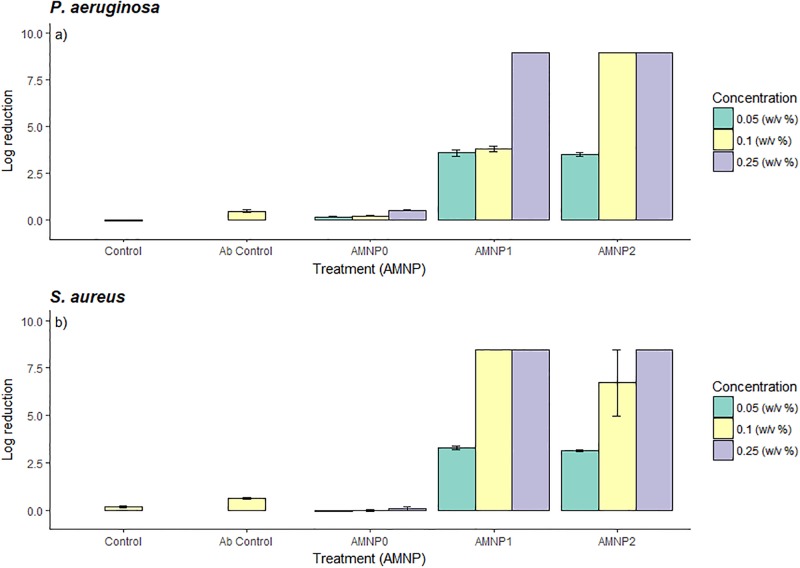
Fig 1. Bar graph showing log reduction for a) P. aeruginosa and b) S. aureus for three AMNP nanoparticle composites (AMNP0, 1 and 2) at different NPC concentrations (0.05, 0.10 and 0.25 w/v%) with an antibody control (Ab control).
A log reduction of >8-log shows complete inhibition of bacterial growth. Data is expressed as mean (n = 3)-/+ SD.

