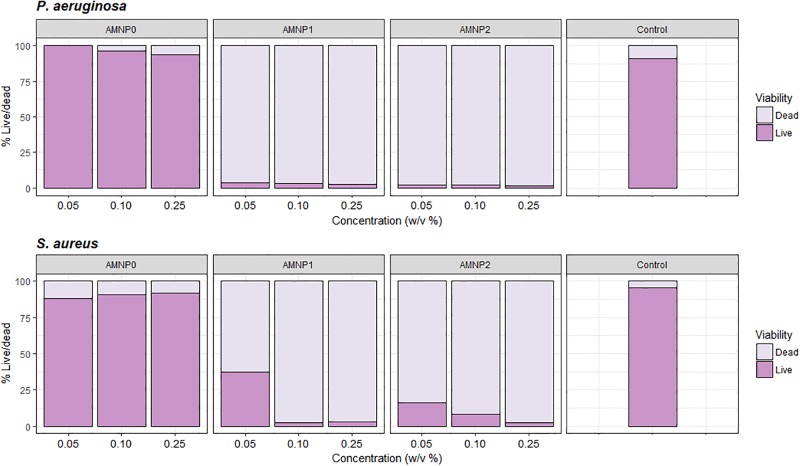
Fig 3. Mean (n = 3) flow cytometry data for proportion of live and dead bacterial populations after exposure to NPCs (AMNP0, 1, 2 and antibiotic control (oxytetracycline)) with a) P. aeruginosa and b) S. aureus.
Proportions of live and dead were calculated using the total absolute cell count by the Guava easyCyte flow cytometer which was determined through gating of the live and dead cell populations (FlowJo V10, TreeStar).

