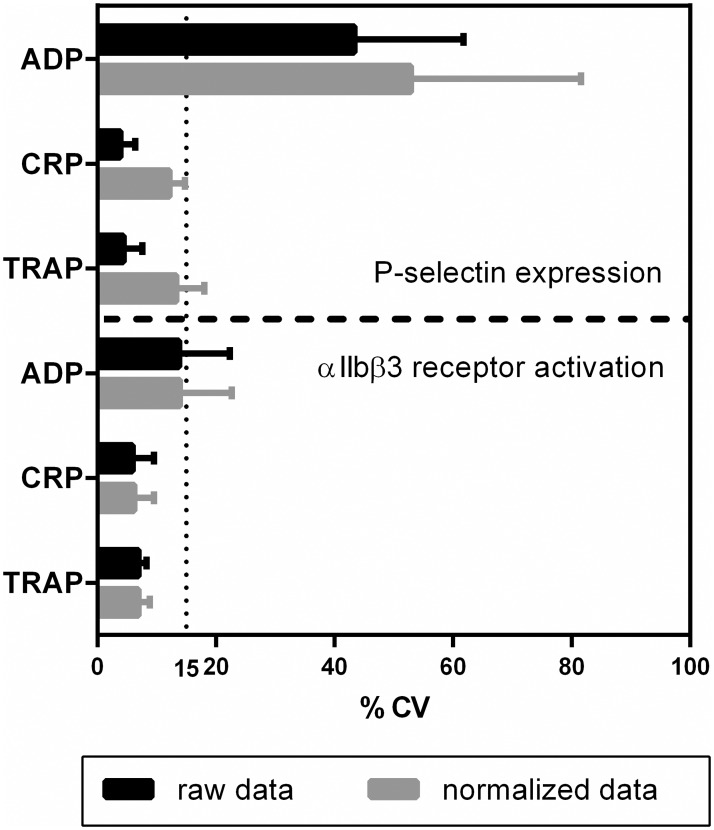
Fig 3. Influence of normalization on the lot-to-lot variability of the platelet activity test.
Five lots of platelet function tests were prepared and stored at -20°C for 1, 4, 7, 8 and 9 months. Whole blood of 4 donors was used to study the variability between the lots. For each condition MFI values were recorded and normalized using the fluorescence measured on the NC and PC beads. Coefficient of variations for both the raw data and normalized data are shown with their corresponding SD.

